Immigrants from Somalia vs Celtic 4 or more Vehicles in Household
COMPARE
Immigrants from Somalia
Celtic
4 or more Vehicles in Household
4 or more Vehicles in Household Comparison
Immigrants from Somalia
Celtics
4.9%
4 OR MORE VEHICLES IN HOUSEHOLD
0.0/ 100
METRIC RATING
309th/ 347
METRIC RANK
7.1%
4 OR MORE VEHICLES IN HOUSEHOLD
99.1/ 100
METRIC RATING
97th/ 347
METRIC RANK
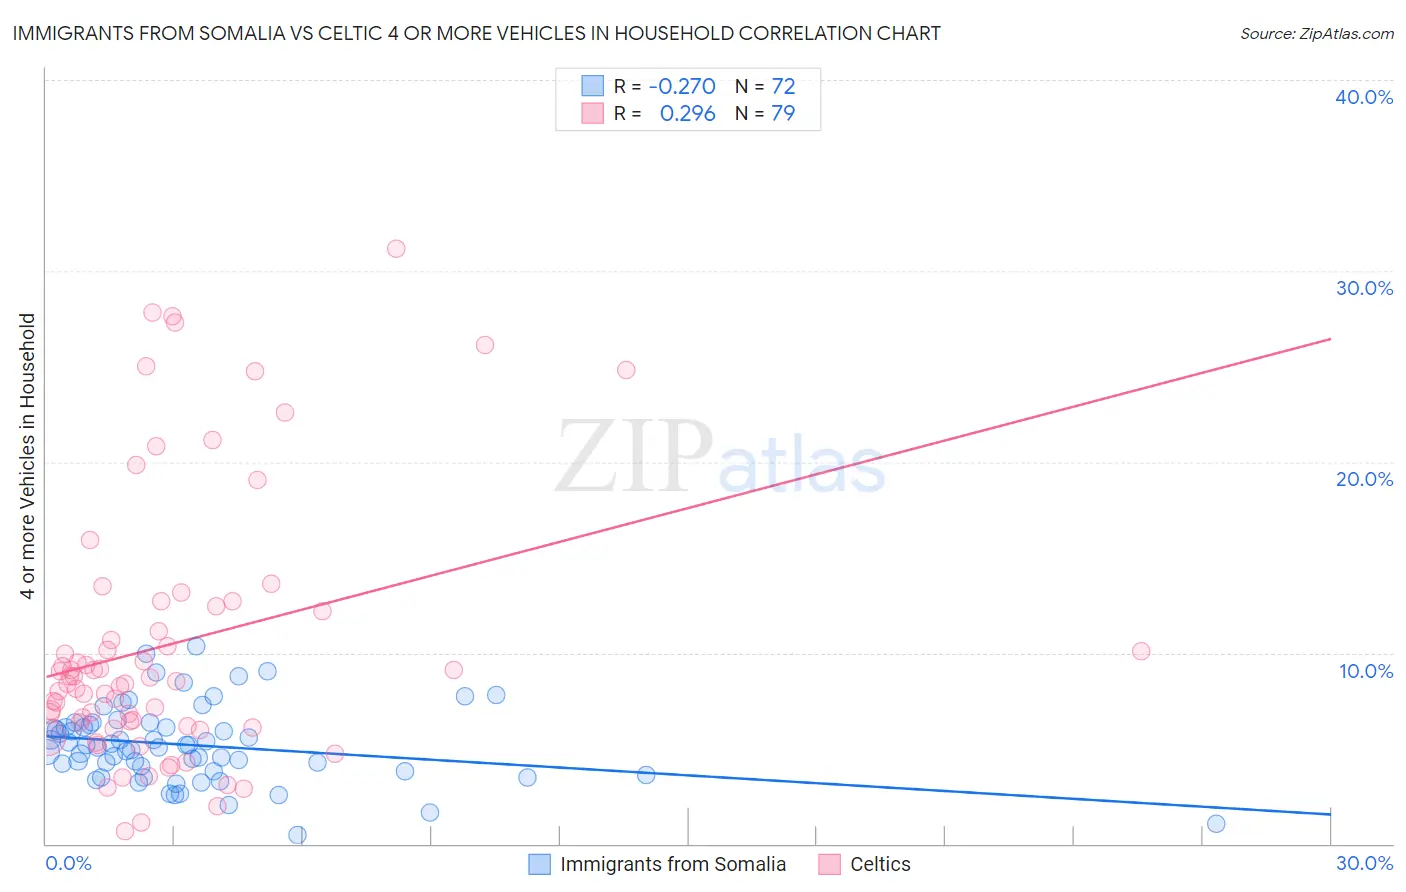
Immigrants from Somalia vs Celtic 4 or more Vehicles in Household Correlation Chart
The statistical analysis conducted on geographies consisting of 91,954,099 people shows a weak negative correlation between the proportion of Immigrants from Somalia and percentage of households with 4 or more vehicles available in the United States with a correlation coefficient (R) of -0.270 and weighted average of 4.9%. Similarly, the statistical analysis conducted on geographies consisting of 168,678,221 people shows a weak positive correlation between the proportion of Celtics and percentage of households with 4 or more vehicles available in the United States with a correlation coefficient (R) of 0.296 and weighted average of 7.1%, a difference of 43.7%.
4 or more Vehicles in Household Correlation Summary
| Measurement | Immigrants from Somalia | Celtic |
| Minimum | 0.49% | 0.62% |
| Maximum | 10.4% | 31.2% |
| Range | 9.9% | 30.6% |
| Mean | 5.2% | 10.5% |
| Median | 5.1% | 8.5% |
| Interquartile 25% (IQ1) | 3.8% | 6.1% |
| Interquartile 75% (IQ3) | 6.2% | 12.5% |
| Interquartile Range (IQR) | 2.4% | 6.3% |
| Standard Deviation (Sample) | 2.0% | 7.0% |
| Standard Deviation (Population) | 2.0% | 7.0% |
Similar Demographics by 4 or more Vehicles in Household
Demographics Similar to Immigrants from Somalia by 4 or more Vehicles in Household
In terms of 4 or more vehicles in household, the demographic groups most similar to Immigrants from Somalia are Paraguayan (4.9%, a difference of 0.15%), Moroccan (4.9%, a difference of 0.38%), Houma (4.9%, a difference of 0.39%), Menominee (5.0%, a difference of 0.87%), and Immigrants from Serbia (5.0%, a difference of 1.8%).
| Demographics | Rating | Rank | 4 or more Vehicles in Household |
| Bahamians | 0.0 /100 | #302 | Tragic 5.1% |
| Immigrants | Greece | 0.0 /100 | #303 | Tragic 5.1% |
| Cypriots | 0.0 /100 | #304 | Tragic 5.0% |
| Somalis | 0.0 /100 | #305 | Tragic 5.0% |
| Immigrants | Serbia | 0.0 /100 | #306 | Tragic 5.0% |
| Menominee | 0.0 /100 | #307 | Tragic 5.0% |
| Paraguayans | 0.0 /100 | #308 | Tragic 4.9% |
| Immigrants | Somalia | 0.0 /100 | #309 | Tragic 4.9% |
| Moroccans | 0.0 /100 | #310 | Tragic 4.9% |
| Houma | 0.0 /100 | #311 | Tragic 4.9% |
| Albanians | 0.0 /100 | #312 | Tragic 4.8% |
| Immigrants | Israel | 0.0 /100 | #313 | Tragic 4.8% |
| Immigrants | West Indies | 0.0 /100 | #314 | Tragic 4.7% |
| Immigrants | Belarus | 0.0 /100 | #315 | Tragic 4.7% |
| Puerto Ricans | 0.0 /100 | #316 | Tragic 4.7% |
Demographics Similar to Celtics by 4 or more Vehicles in Household
In terms of 4 or more vehicles in household, the demographic groups most similar to Celtics are Central American (7.1%, a difference of 0.35%), Czechoslovakian (7.1%, a difference of 0.37%), Irish (7.1%, a difference of 0.42%), Dutch West Indian (7.1%, a difference of 0.58%), and Immigrants from Afghanistan (7.1%, a difference of 0.59%).
| Demographics | Rating | Rank | 4 or more Vehicles in Household |
| Creek | 99.6 /100 | #90 | Exceptional 7.2% |
| Assyrians/Chaldeans/Syriacs | 99.4 /100 | #91 | Exceptional 7.2% |
| Immigrants | Latin America | 99.4 /100 | #92 | Exceptional 7.1% |
| Immigrants | Afghanistan | 99.3 /100 | #93 | Exceptional 7.1% |
| Dutch West Indians | 99.3 /100 | #94 | Exceptional 7.1% |
| Czechoslovakians | 99.3 /100 | #95 | Exceptional 7.1% |
| Central Americans | 99.3 /100 | #96 | Exceptional 7.1% |
| Celtics | 99.1 /100 | #97 | Exceptional 7.1% |
| Irish | 99.0 /100 | #98 | Exceptional 7.1% |
| Seminole | 98.8 /100 | #99 | Exceptional 7.0% |
| Taiwanese | 98.7 /100 | #100 | Exceptional 7.0% |
| Pakistanis | 98.7 /100 | #101 | Exceptional 7.0% |
| Asians | 98.6 /100 | #102 | Exceptional 7.0% |
| Blackfeet | 98.6 /100 | #103 | Exceptional 7.0% |
| Hmong | 98.3 /100 | #104 | Exceptional 7.0% |