Immigrants from Hungary vs Celtic Doctorate Degree
COMPARE
Immigrants from Hungary
Celtic
Doctorate Degree
Doctorate Degree Comparison
Immigrants from Hungary
Celtics
2.2%
DOCTORATE DEGREE
99.8/ 100
METRIC RATING
76th/ 347
METRIC RANK
1.9%
DOCTORATE DEGREE
66.7/ 100
METRIC RATING
164th/ 347
METRIC RANK
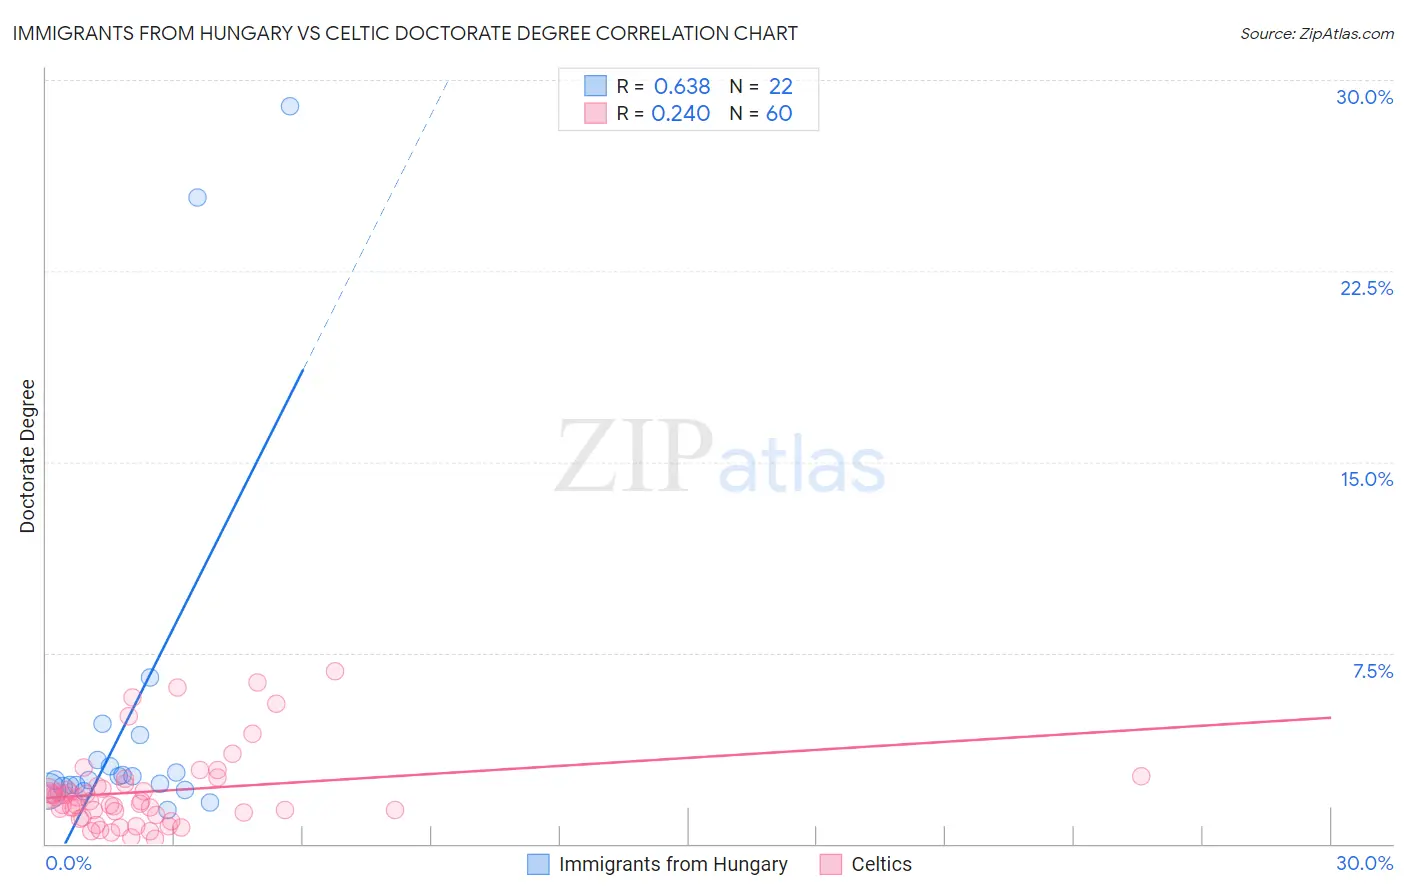
Immigrants from Hungary vs Celtic Doctorate Degree Correlation Chart
The statistical analysis conducted on geographies consisting of 195,058,211 people shows a significant positive correlation between the proportion of Immigrants from Hungary and percentage of population with at least doctorate degree education in the United States with a correlation coefficient (R) of 0.638 and weighted average of 2.2%. Similarly, the statistical analysis conducted on geographies consisting of 167,913,023 people shows a weak positive correlation between the proportion of Celtics and percentage of population with at least doctorate degree education in the United States with a correlation coefficient (R) of 0.240 and weighted average of 1.9%, a difference of 19.1%.
Doctorate Degree Correlation Summary
| Measurement | Immigrants from Hungary | Celtic |
| Minimum | 1.3% | 0.17% |
| Maximum | 29.0% | 6.8% |
| Range | 27.7% | 6.6% |
| Mean | 5.0% | 2.1% |
| Median | 2.6% | 1.7% |
| Interquartile 25% (IQ1) | 2.2% | 1.2% |
| Interquartile 75% (IQ3) | 3.3% | 2.3% |
| Interquartile Range (IQR) | 1.1% | 1.1% |
| Standard Deviation (Sample) | 7.3% | 1.5% |
| Standard Deviation (Population) | 7.1% | 1.5% |
Similar Demographics by Doctorate Degree
Demographics Similar to Immigrants from Hungary by Doctorate Degree
In terms of doctorate degree, the demographic groups most similar to Immigrants from Hungary are Immigrants from Lebanon (2.2%, a difference of 0.010%), Immigrants from Western Asia (2.2%, a difference of 0.070%), Immigrants from North America (2.2%, a difference of 0.18%), Immigrants from Bulgaria (2.3%, a difference of 0.31%), and Immigrants from Canada (2.3%, a difference of 0.40%).
| Demographics | Rating | Rank | Doctorate Degree |
| Carpatho Rusyns | 99.8 /100 | #69 | Exceptional 2.3% |
| Lithuanians | 99.8 /100 | #70 | Exceptional 2.3% |
| Immigrants | Bolivia | 99.8 /100 | #71 | Exceptional 2.3% |
| Immigrants | Canada | 99.8 /100 | #72 | Exceptional 2.3% |
| Immigrants | Bulgaria | 99.8 /100 | #73 | Exceptional 2.3% |
| Immigrants | North America | 99.8 /100 | #74 | Exceptional 2.2% |
| Immigrants | Western Asia | 99.8 /100 | #75 | Exceptional 2.2% |
| Immigrants | Hungary | 99.8 /100 | #76 | Exceptional 2.2% |
| Immigrants | Lebanon | 99.8 /100 | #77 | Exceptional 2.2% |
| Immigrants | Belarus | 99.7 /100 | #78 | Exceptional 2.2% |
| Northern Europeans | 99.7 /100 | #79 | Exceptional 2.2% |
| Ugandans | 99.7 /100 | #80 | Exceptional 2.2% |
| Immigrants | Argentina | 99.7 /100 | #81 | Exceptional 2.2% |
| Immigrants | Uganda | 99.6 /100 | #82 | Exceptional 2.2% |
| Immigrants | Lithuania | 99.6 /100 | #83 | Exceptional 2.2% |
Demographics Similar to Celtics by Doctorate Degree
In terms of doctorate degree, the demographic groups most similar to Celtics are Czech (1.9%, a difference of 0.10%), Irish (1.9%, a difference of 0.13%), Immigrants from Middle Africa (1.9%, a difference of 0.35%), Scotch-Irish (1.9%, a difference of 0.49%), and Welsh (1.9%, a difference of 0.50%).
| Demographics | Rating | Rank | Doctorate Degree |
| Danes | 71.9 /100 | #157 | Good 1.9% |
| Hungarians | 71.7 /100 | #158 | Good 1.9% |
| Slovenes | 70.2 /100 | #159 | Good 1.9% |
| Welsh | 69.7 /100 | #160 | Good 1.9% |
| Immigrants | Middle Africa | 68.8 /100 | #161 | Good 1.9% |
| Irish | 67.5 /100 | #162 | Good 1.9% |
| Czechs | 67.3 /100 | #163 | Good 1.9% |
| Celtics | 66.7 /100 | #164 | Good 1.9% |
| Scotch-Irish | 63.6 /100 | #165 | Good 1.9% |
| Spaniards | 63.5 /100 | #166 | Good 1.9% |
| Macedonians | 60.9 /100 | #167 | Good 1.9% |
| Sri Lankans | 60.3 /100 | #168 | Good 1.9% |
| Vietnamese | 54.8 /100 | #169 | Average 1.9% |
| Costa Ricans | 53.3 /100 | #170 | Average 1.8% |
| Bermudans | 52.1 /100 | #171 | Average 1.8% |