Immigrants from Grenada vs Spanish American 2 or more Vehicles in Household
COMPARE
Immigrants from Grenada
Spanish American
2 or more Vehicles in Household
2 or more Vehicles in Household Comparison
Immigrants from Grenada
Spanish Americans
28.7%
2 OR MORE VEHICLES IN HOUSEHOLD
0.0/ 100
METRIC RATING
347th/ 347
METRIC RANK
58.9%
2 OR MORE VEHICLES IN HOUSEHOLD
99.8/ 100
METRIC RATING
59th/ 347
METRIC RANK
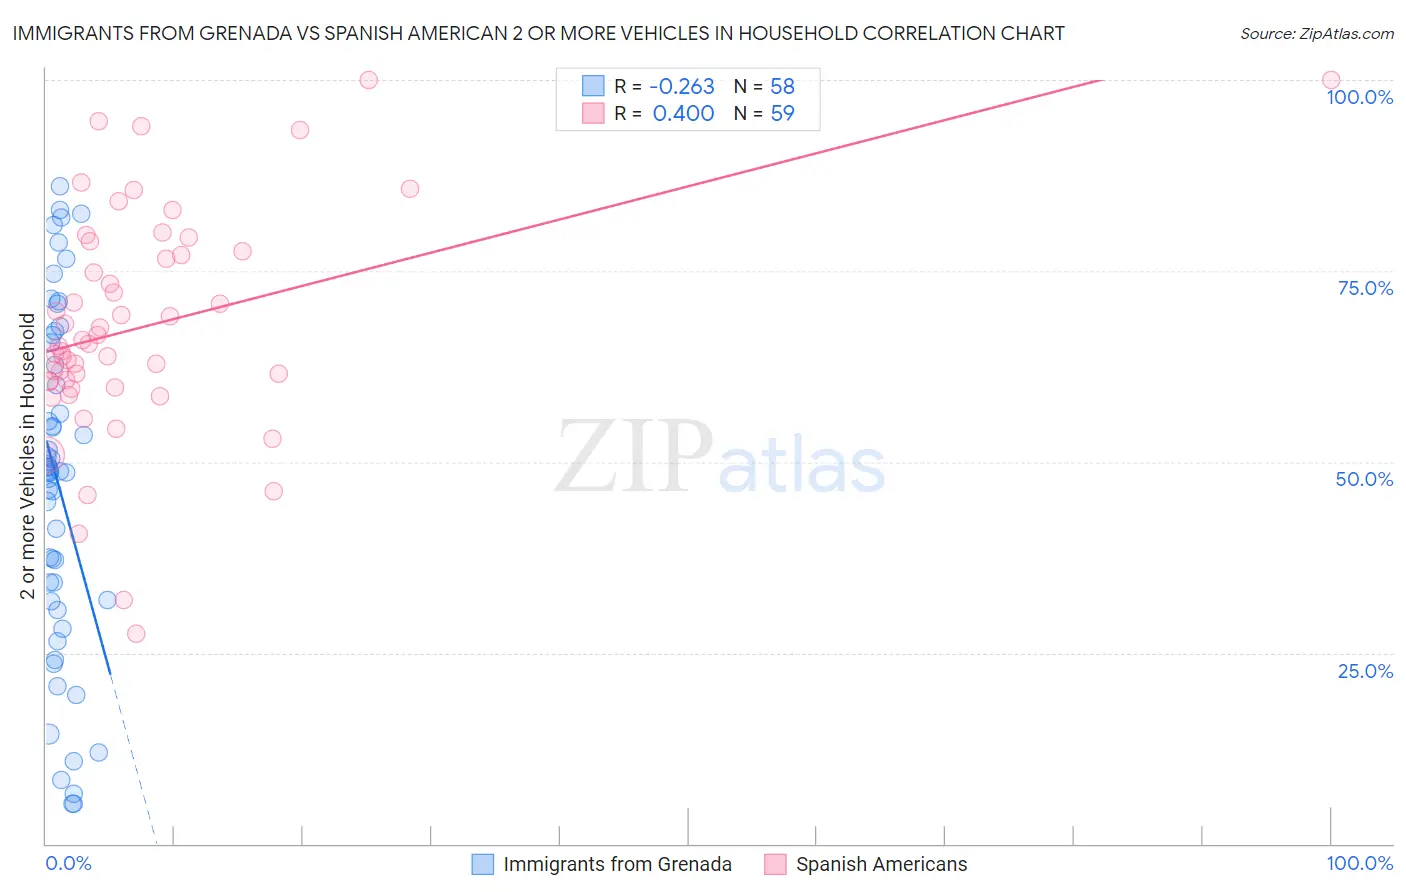
Immigrants from Grenada vs Spanish American 2 or more Vehicles in Household Correlation Chart
The statistical analysis conducted on geographies consisting of 67,200,374 people shows a weak negative correlation between the proportion of Immigrants from Grenada and percentage of households with 2 or more vehicles available in the United States with a correlation coefficient (R) of -0.263 and weighted average of 28.7%. Similarly, the statistical analysis conducted on geographies consisting of 103,168,567 people shows a moderate positive correlation between the proportion of Spanish Americans and percentage of households with 2 or more vehicles available in the United States with a correlation coefficient (R) of 0.400 and weighted average of 58.9%, a difference of 105.4%.
2 or more Vehicles in Household Correlation Summary
| Measurement | Immigrants from Grenada | Spanish American |
| Minimum | 5.2% | 27.4% |
| Maximum | 86.2% | 100.0% |
| Range | 81.0% | 72.6% |
| Mean | 46.9% | 67.8% |
| Median | 48.8% | 65.5% |
| Interquartile 25% (IQ1) | 31.8% | 60.5% |
| Interquartile 75% (IQ3) | 65.6% | 77.5% |
| Interquartile Range (IQR) | 33.8% | 17.0% |
| Standard Deviation (Sample) | 22.2% | 14.9% |
| Standard Deviation (Population) | 22.0% | 14.8% |
Similar Demographics by 2 or more Vehicles in Household
Demographics Similar to Immigrants from Grenada by 2 or more Vehicles in Household
In terms of 2 or more vehicles in household, the demographic groups most similar to Immigrants from Grenada are Immigrants from St. Vincent and the Grenadines (31.0%, a difference of 8.1%), Immigrants from Dominican Republic (33.2%, a difference of 16.0%), Yup'ik (34.9%, a difference of 21.9%), Immigrants from Guyana (35.0%, a difference of 22.1%), and Dominican (35.3%, a difference of 23.2%).
| Demographics | Rating | Rank | 2 or more Vehicles in Household |
| Immigrants | Ecuador | 0.0 /100 | #333 | Tragic 40.5% |
| Immigrants | Trinidad and Tobago | 0.0 /100 | #334 | Tragic 40.3% |
| Immigrants | Bangladesh | 0.0 /100 | #335 | Tragic 38.8% |
| Vietnamese | 0.0 /100 | #336 | Tragic 38.5% |
| Barbadians | 0.0 /100 | #337 | Tragic 38.3% |
| Immigrants | Uzbekistan | 0.0 /100 | #338 | Tragic 37.9% |
| Immigrants | Barbados | 0.0 /100 | #339 | Tragic 35.8% |
| British West Indians | 0.0 /100 | #340 | Tragic 35.4% |
| Guyanese | 0.0 /100 | #341 | Tragic 35.4% |
| Dominicans | 0.0 /100 | #342 | Tragic 35.3% |
| Immigrants | Guyana | 0.0 /100 | #343 | Tragic 35.0% |
| Yup'ik | 0.0 /100 | #344 | Tragic 34.9% |
| Immigrants | Dominican Republic | 0.0 /100 | #345 | Tragic 33.2% |
| Immigrants | St. Vincent and the Grenadines | 0.0 /100 | #346 | Tragic 31.0% |
| Immigrants | Grenada | 0.0 /100 | #347 | Tragic 28.7% |
Demographics Similar to Spanish Americans by 2 or more Vehicles in Household
In terms of 2 or more vehicles in household, the demographic groups most similar to Spanish Americans are Immigrants from Scotland (58.9%, a difference of 0.020%), French Canadian (58.9%, a difference of 0.030%), Osage (58.8%, a difference of 0.16%), Nonimmigrants (58.8%, a difference of 0.19%), and Chickasaw (59.0%, a difference of 0.21%).
| Demographics | Rating | Rank | 2 or more Vehicles in Household |
| Immigrants | Laos | 99.9 /100 | #52 | Exceptional 59.2% |
| Celtics | 99.9 /100 | #53 | Exceptional 59.2% |
| Bhutanese | 99.9 /100 | #54 | Exceptional 59.1% |
| Luxembourgers | 99.9 /100 | #55 | Exceptional 59.1% |
| Chickasaw | 99.9 /100 | #56 | Exceptional 59.0% |
| Afghans | 99.9 /100 | #57 | Exceptional 59.0% |
| Immigrants | Scotland | 99.8 /100 | #58 | Exceptional 58.9% |
| Spanish Americans | 99.8 /100 | #59 | Exceptional 58.9% |
| French Canadians | 99.8 /100 | #60 | Exceptional 58.9% |
| Osage | 99.8 /100 | #61 | Exceptional 58.8% |
| Immigrants | Nonimmigrants | 99.8 /100 | #62 | Exceptional 58.8% |
| Mexican American Indians | 99.8 /100 | #63 | Exceptional 58.7% |
| Portuguese | 99.7 /100 | #64 | Exceptional 58.6% |
| Immigrants | Central America | 99.7 /100 | #65 | Exceptional 58.6% |
| Croatians | 99.7 /100 | #66 | Exceptional 58.6% |