Immigrants from Grenada vs Sierra Leonean Disability Age 5 to 17
COMPARE
Immigrants from Grenada
Sierra Leonean
Disability Age 5 to 17
Disability Age 5 to 17 Comparison
Immigrants from Grenada
Sierra Leoneans
5.3%
DISABILITY AGE 5 TO 17
99.1/ 100
METRIC RATING
95th/ 347
METRIC RANK
5.8%
DISABILITY AGE 5 TO 17
7.0/ 100
METRIC RATING
219th/ 347
METRIC RANK
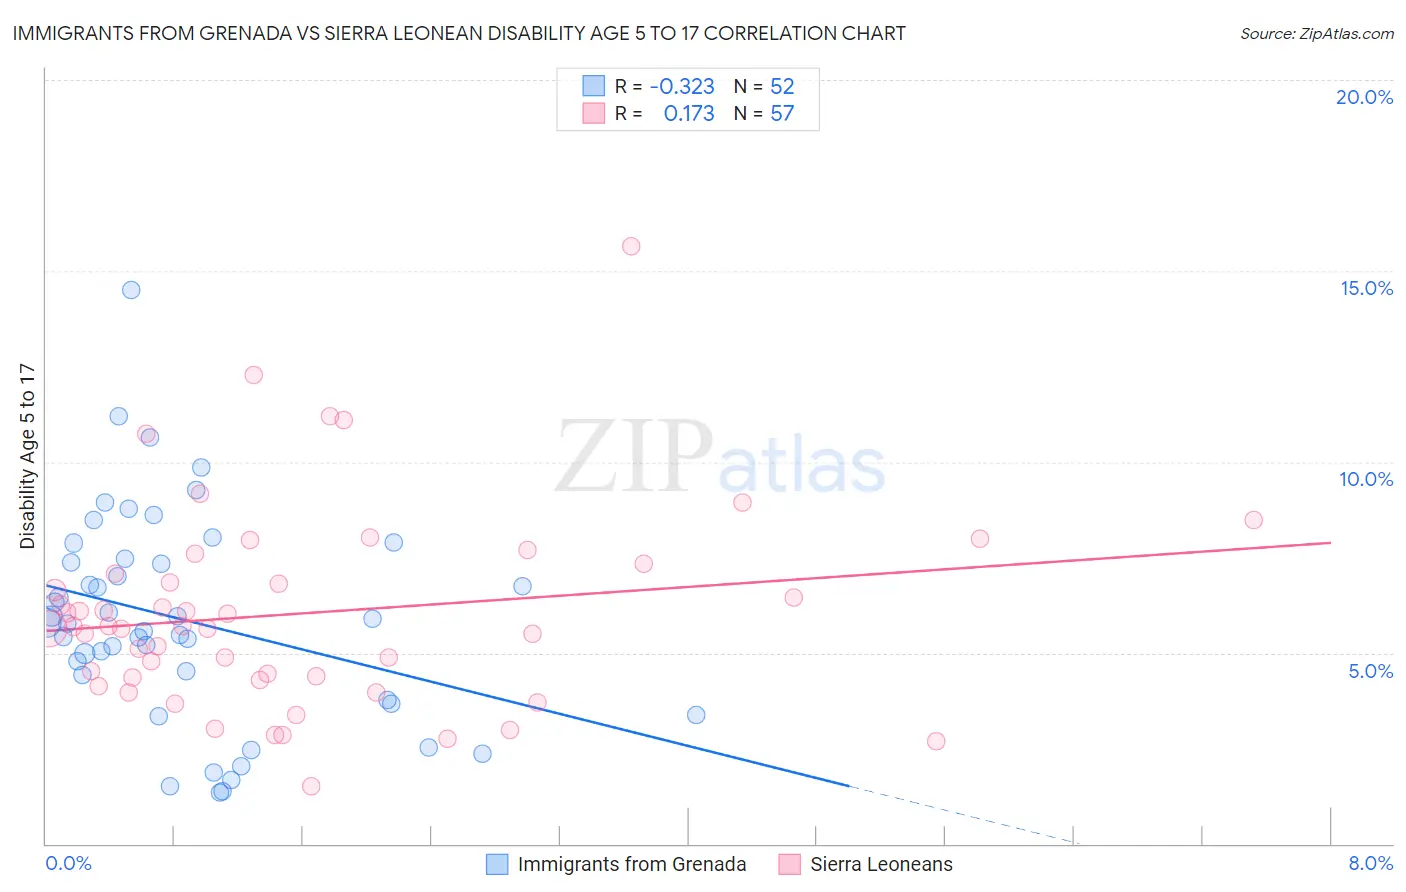
Immigrants from Grenada vs Sierra Leonean Disability Age 5 to 17 Correlation Chart
The statistical analysis conducted on geographies consisting of 67,127,267 people shows a mild negative correlation between the proportion of Immigrants from Grenada and percentage of population with a disability between the ages 5 and 17 in the United States with a correlation coefficient (R) of -0.323 and weighted average of 5.3%. Similarly, the statistical analysis conducted on geographies consisting of 83,260,070 people shows a poor positive correlation between the proportion of Sierra Leoneans and percentage of population with a disability between the ages 5 and 17 in the United States with a correlation coefficient (R) of 0.173 and weighted average of 5.8%, a difference of 9.5%.
Disability Age 5 to 17 Correlation Summary
| Measurement | Immigrants from Grenada | Sierra Leonean |
| Minimum | 1.4% | 1.5% |
| Maximum | 14.5% | 15.7% |
| Range | 13.2% | 14.2% |
| Mean | 5.9% | 6.0% |
| Median | 5.8% | 5.7% |
| Interquartile 25% (IQ1) | 4.1% | 4.3% |
| Interquartile 75% (IQ3) | 7.4% | 7.2% |
| Interquartile Range (IQR) | 3.3% | 2.9% |
| Standard Deviation (Sample) | 2.7% | 2.6% |
| Standard Deviation (Population) | 2.7% | 2.6% |
Similar Demographics by Disability Age 5 to 17
Demographics Similar to Immigrants from Grenada by Disability Age 5 to 17
In terms of disability age 5 to 17, the demographic groups most similar to Immigrants from Grenada are Immigrants from Jordan (5.3%, a difference of 0.020%), Immigrants from Peru (5.3%, a difference of 0.090%), Luxembourger (5.3%, a difference of 0.16%), Immigrants from El Salvador (5.3%, a difference of 0.16%), and Immigrants from Europe (5.3%, a difference of 0.16%).
| Demographics | Rating | Rank | Disability Age 5 to 17 |
| Immigrants | Croatia | 99.4 /100 | #88 | Exceptional 5.2% |
| Immigrants | Spain | 99.4 /100 | #89 | Exceptional 5.2% |
| Immigrants | Kuwait | 99.4 /100 | #90 | Exceptional 5.3% |
| Mongolians | 99.2 /100 | #91 | Exceptional 5.3% |
| Luxembourgers | 99.2 /100 | #92 | Exceptional 5.3% |
| Immigrants | Peru | 99.1 /100 | #93 | Exceptional 5.3% |
| Immigrants | Jordan | 99.1 /100 | #94 | Exceptional 5.3% |
| Immigrants | Grenada | 99.1 /100 | #95 | Exceptional 5.3% |
| Immigrants | El Salvador | 99.0 /100 | #96 | Exceptional 5.3% |
| Immigrants | Europe | 99.0 /100 | #97 | Exceptional 5.3% |
| Immigrants | Austria | 98.9 /100 | #98 | Exceptional 5.3% |
| Cambodians | 98.8 /100 | #99 | Exceptional 5.3% |
| Nepalese | 98.7 /100 | #100 | Exceptional 5.3% |
| Menominee | 98.7 /100 | #101 | Exceptional 5.3% |
| Nicaraguans | 98.6 /100 | #102 | Exceptional 5.3% |
Demographics Similar to Sierra Leoneans by Disability Age 5 to 17
In terms of disability age 5 to 17, the demographic groups most similar to Sierra Leoneans are Immigrants from Sierra Leone (5.8%, a difference of 0.010%), Belgian (5.8%, a difference of 0.010%), Lithuanian (5.8%, a difference of 0.050%), Czech (5.8%, a difference of 0.060%), and Immigrants from Sudan (5.8%, a difference of 0.060%).
| Demographics | Rating | Rank | Disability Age 5 to 17 |
| Immigrants | Panama | 8.7 /100 | #212 | Tragic 5.8% |
| Immigrants | Cameroon | 8.3 /100 | #213 | Tragic 5.8% |
| Immigrants | Morocco | 8.3 /100 | #214 | Tragic 5.8% |
| Swedes | 8.1 /100 | #215 | Tragic 5.8% |
| Nigerians | 7.5 /100 | #216 | Tragic 5.8% |
| Czechs | 7.4 /100 | #217 | Tragic 5.8% |
| Immigrants | Sierra Leone | 7.1 /100 | #218 | Tragic 5.8% |
| Sierra Leoneans | 7.0 /100 | #219 | Tragic 5.8% |
| Belgians | 6.9 /100 | #220 | Tragic 5.8% |
| Lithuanians | 6.7 /100 | #221 | Tragic 5.8% |
| Immigrants | Sudan | 6.7 /100 | #222 | Tragic 5.8% |
| Alsatians | 6.0 /100 | #223 | Tragic 5.8% |
| Mexicans | 5.7 /100 | #224 | Tragic 5.8% |
| Guamanians/Chamorros | 5.6 /100 | #225 | Tragic 5.8% |
| British West Indians | 5.4 /100 | #226 | Tragic 5.8% |