Moroccan vs Immigrants from Yemen 1 or more Vehicles in Household
COMPARE
Moroccan
Immigrants from Yemen
1 or more Vehicles in Household
1 or more Vehicles in Household Comparison
Moroccans
Immigrants from Yemen
85.4%
1 OR MORE VEHICLES IN HOUSEHOLD
0.0/ 100
METRIC RATING
302nd/ 347
METRIC RANK
80.5%
1 OR MORE VEHICLES IN HOUSEHOLD
0.0/ 100
METRIC RATING
323rd/ 347
METRIC RANK
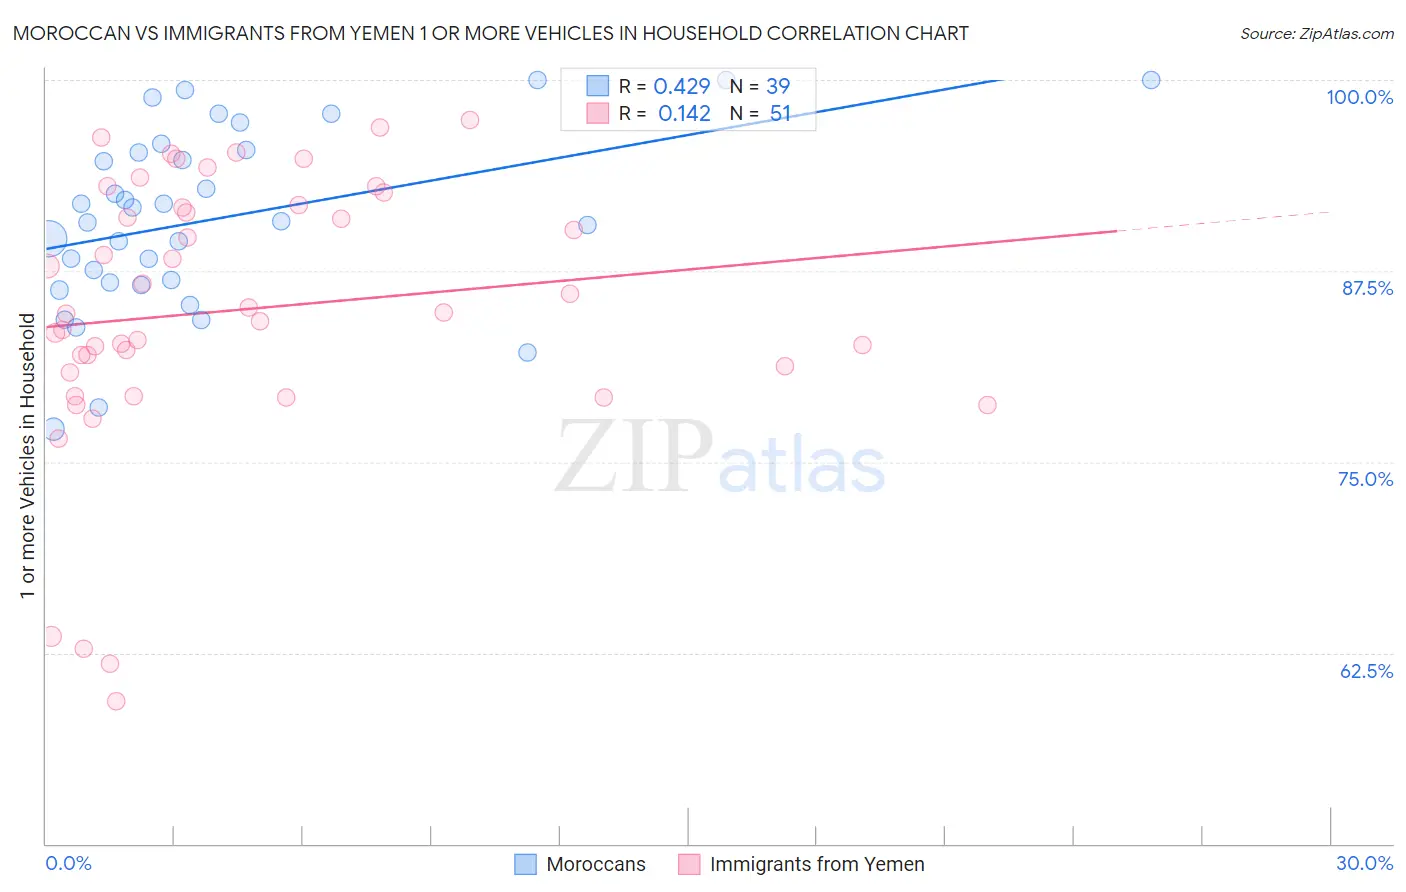
Moroccan vs Immigrants from Yemen 1 or more Vehicles in Household Correlation Chart
The statistical analysis conducted on geographies consisting of 201,766,092 people shows a moderate positive correlation between the proportion of Moroccans and percentage of households with 1 or more vehicles available in the United States with a correlation coefficient (R) of 0.429 and weighted average of 85.4%. Similarly, the statistical analysis conducted on geographies consisting of 82,433,611 people shows a poor positive correlation between the proportion of Immigrants from Yemen and percentage of households with 1 or more vehicles available in the United States with a correlation coefficient (R) of 0.142 and weighted average of 80.5%, a difference of 6.0%.
1 or more Vehicles in Household Correlation Summary
| Measurement | Moroccan | Immigrants from Yemen |
| Minimum | 77.2% | 59.3% |
| Maximum | 100.0% | 97.4% |
| Range | 22.8% | 38.1% |
| Mean | 90.9% | 85.0% |
| Median | 90.8% | 84.8% |
| Interquartile 25% (IQ1) | 86.7% | 80.8% |
| Interquartile 75% (IQ3) | 95.5% | 91.8% |
| Interquartile Range (IQR) | 8.7% | 11.0% |
| Standard Deviation (Sample) | 5.9% | 9.0% |
| Standard Deviation (Population) | 5.8% | 8.9% |
Similar Demographics by 1 or more Vehicles in Household
Demographics Similar to Moroccans by 1 or more Vehicles in Household
In terms of 1 or more vehicles in household, the demographic groups most similar to Moroccans are Immigrants from Panama (85.4%, a difference of 0.020%), Immigrants from Greece (85.4%, a difference of 0.030%), Immigrants from Russia (85.4%, a difference of 0.060%), Yuman (85.5%, a difference of 0.070%), and Immigrants from Ukraine (85.2%, a difference of 0.20%).
| Demographics | Rating | Rank | 1 or more Vehicles in Household |
| Immigrants | Jamaica | 0.0 /100 | #295 | Tragic 85.8% |
| Immigrants | Spain | 0.0 /100 | #296 | Tragic 85.8% |
| Paraguayans | 0.0 /100 | #297 | Tragic 85.7% |
| Belizeans | 0.0 /100 | #298 | Tragic 85.7% |
| Yuman | 0.0 /100 | #299 | Tragic 85.5% |
| Immigrants | Russia | 0.0 /100 | #300 | Tragic 85.4% |
| Immigrants | Panama | 0.0 /100 | #301 | Tragic 85.4% |
| Moroccans | 0.0 /100 | #302 | Tragic 85.4% |
| Immigrants | Greece | 0.0 /100 | #303 | Tragic 85.4% |
| Immigrants | Ukraine | 0.0 /100 | #304 | Tragic 85.2% |
| Immigrants | China | 0.0 /100 | #305 | Tragic 84.9% |
| Immigrants | Western Africa | 0.0 /100 | #306 | Tragic 84.9% |
| Tohono O'odham | 0.0 /100 | #307 | Tragic 84.7% |
| Immigrants | Belize | 0.0 /100 | #308 | Tragic 84.7% |
| Immigrants | Haiti | 0.0 /100 | #309 | Tragic 84.7% |
Demographics Similar to Immigrants from Yemen by 1 or more Vehicles in Household
In terms of 1 or more vehicles in household, the demographic groups most similar to Immigrants from Yemen are Immigrants from Caribbean (80.4%, a difference of 0.11%), Senegalese (80.4%, a difference of 0.22%), Immigrants from West Indies (79.5%, a difference of 1.3%), Immigrants from Cabo Verde (81.6%, a difference of 1.3%), and Immigrants from Senegal (79.0%, a difference of 1.9%).
| Demographics | Rating | Rank | 1 or more Vehicles in Household |
| Alaska Natives | 0.0 /100 | #316 | Tragic 83.8% |
| Ghanaians | 0.0 /100 | #317 | Tragic 83.6% |
| Immigrants | Ghana | 0.0 /100 | #318 | Tragic 83.4% |
| Immigrants | Belarus | 0.0 /100 | #319 | Tragic 83.3% |
| Soviet Union | 0.0 /100 | #320 | Tragic 82.7% |
| Jamaicans | 0.0 /100 | #321 | Tragic 82.1% |
| Immigrants | Cabo Verde | 0.0 /100 | #322 | Tragic 81.6% |
| Immigrants | Yemen | 0.0 /100 | #323 | Tragic 80.5% |
| Immigrants | Caribbean | 0.0 /100 | #324 | Tragic 80.4% |
| Senegalese | 0.0 /100 | #325 | Tragic 80.4% |
| Immigrants | West Indies | 0.0 /100 | #326 | Tragic 79.5% |
| Immigrants | Senegal | 0.0 /100 | #327 | Tragic 79.0% |
| Ecuadorians | 0.0 /100 | #328 | Tragic 77.9% |
| Immigrants | Dominica | 0.0 /100 | #329 | Tragic 77.8% |
| Immigrants | Trinidad and Tobago | 0.0 /100 | #330 | Tragic 76.8% |