Immigrants from Ghana vs Immigrants 4 or more Vehicles in Household
COMPARE
Immigrants from Ghana
Immigrants
4 or more Vehicles in Household
4 or more Vehicles in Household Comparison
Immigrants from Ghana
Immigrants
5.2%
4 OR MORE VEHICLES IN HOUSEHOLD
0.1/ 100
METRIC RATING
299th/ 347
METRIC RANK
6.8%
4 OR MORE VEHICLES IN HOUSEHOLD
94.6/ 100
METRIC RATING
123rd/ 347
METRIC RANK
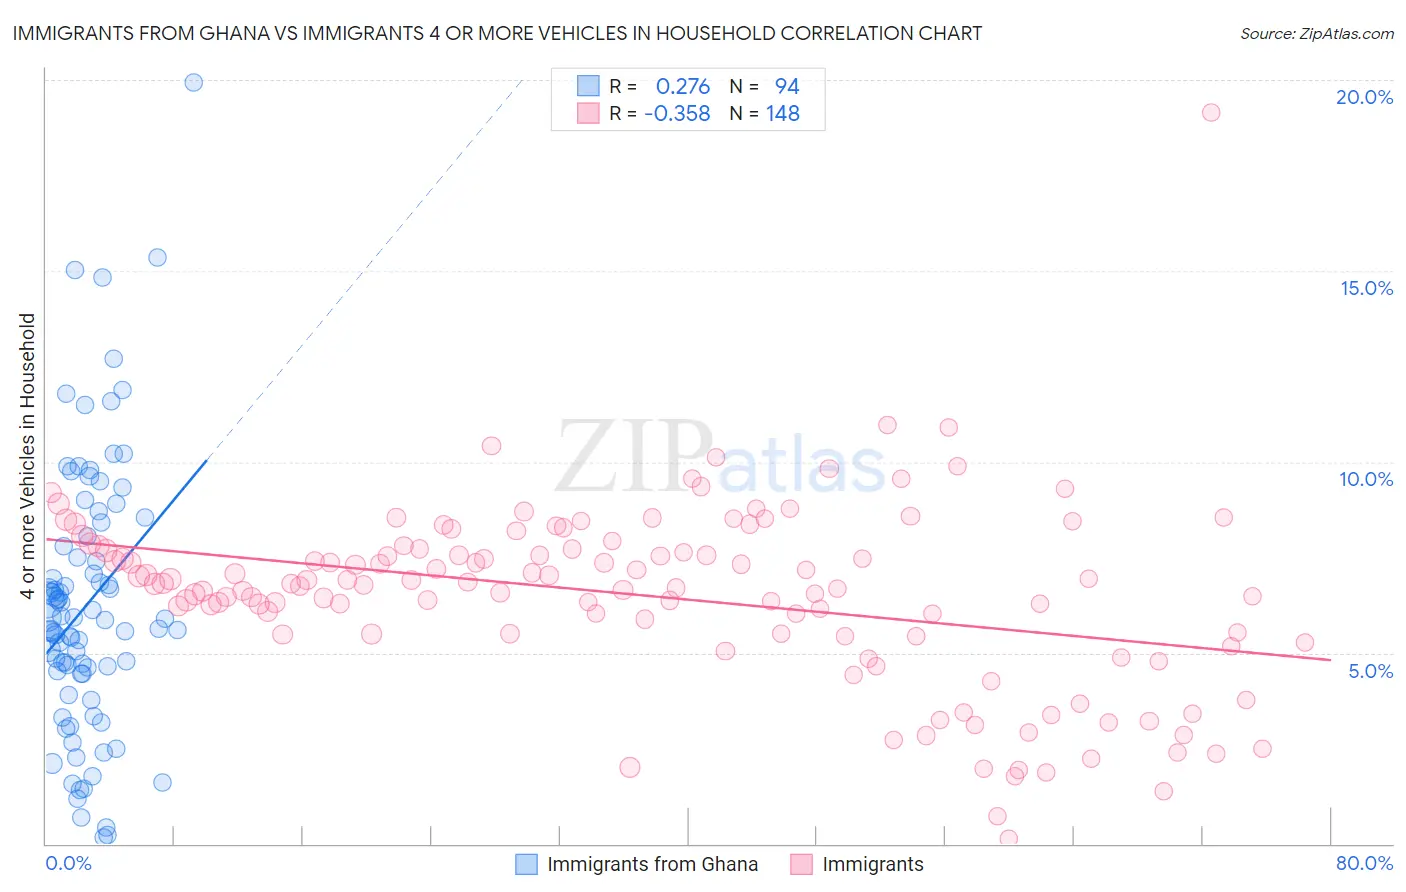
Immigrants from Ghana vs Immigrants 4 or more Vehicles in Household Correlation Chart
The statistical analysis conducted on geographies consisting of 198,971,687 people shows a weak positive correlation between the proportion of Immigrants from Ghana and percentage of households with 4 or more vehicles available in the United States with a correlation coefficient (R) of 0.276 and weighted average of 5.2%. Similarly, the statistical analysis conducted on geographies consisting of 573,807,662 people shows a mild negative correlation between the proportion of Immigrants and percentage of households with 4 or more vehicles available in the United States with a correlation coefficient (R) of -0.358 and weighted average of 6.8%, a difference of 31.1%.
4 or more Vehicles in Household Correlation Summary
| Measurement | Immigrants from Ghana | Immigrants |
| Minimum | 0.17% | 0.13% |
| Maximum | 19.9% | 19.1% |
| Range | 19.8% | 19.0% |
| Mean | 6.3% | 6.5% |
| Median | 5.9% | 6.8% |
| Interquartile 25% (IQ1) | 4.4% | 5.5% |
| Interquartile 75% (IQ3) | 8.1% | 7.8% |
| Interquartile Range (IQR) | 3.6% | 2.3% |
| Standard Deviation (Sample) | 3.6% | 2.4% |
| Standard Deviation (Population) | 3.5% | 2.4% |
Similar Demographics by 4 or more Vehicles in Household
Demographics Similar to Immigrants from Ghana by 4 or more Vehicles in Household
In terms of 4 or more vehicles in household, the demographic groups most similar to Immigrants from Ghana are Immigrants from South America (5.2%, a difference of 0.46%), Immigrants from Venezuela (5.2%, a difference of 0.79%), Israeli (5.2%, a difference of 1.1%), Immigrants from Brazil (5.2%, a difference of 1.3%), and Ghanaian (5.2%, a difference of 1.4%).
| Demographics | Rating | Rank | 4 or more Vehicles in Household |
| Liberians | 0.1 /100 | #292 | Tragic 5.3% |
| Immigrants | Congo | 0.1 /100 | #293 | Tragic 5.2% |
| Ghanaians | 0.1 /100 | #294 | Tragic 5.2% |
| Immigrants | Brazil | 0.1 /100 | #295 | Tragic 5.2% |
| Israelis | 0.1 /100 | #296 | Tragic 5.2% |
| Immigrants | Venezuela | 0.1 /100 | #297 | Tragic 5.2% |
| Immigrants | South America | 0.1 /100 | #298 | Tragic 5.2% |
| Immigrants | Ghana | 0.1 /100 | #299 | Tragic 5.2% |
| Immigrants | Morocco | 0.0 /100 | #300 | Tragic 5.1% |
| Immigrants | Zaire | 0.0 /100 | #301 | Tragic 5.1% |
| Bahamians | 0.0 /100 | #302 | Tragic 5.1% |
| Immigrants | Greece | 0.0 /100 | #303 | Tragic 5.1% |
| Cypriots | 0.0 /100 | #304 | Tragic 5.0% |
| Somalis | 0.0 /100 | #305 | Tragic 5.0% |
| Immigrants | Serbia | 0.0 /100 | #306 | Tragic 5.0% |
Demographics Similar to Immigrants by 4 or more Vehicles in Household
In terms of 4 or more vehicles in household, the demographic groups most similar to Immigrants are Immigrants from Nicaragua (6.8%, a difference of 0.060%), Immigrants from Germany (6.8%, a difference of 0.070%), Immigrants from Asia (6.8%, a difference of 0.10%), Comanche (6.8%, a difference of 0.13%), and Austrian (6.8%, a difference of 0.19%).
| Demographics | Rating | Rank | 4 or more Vehicles in Household |
| Immigrants | Guatemala | 95.8 /100 | #116 | Exceptional 6.8% |
| Burmese | 95.7 /100 | #117 | Exceptional 6.8% |
| French American Indians | 95.7 /100 | #118 | Exceptional 6.8% |
| Costa Ricans | 95.5 /100 | #119 | Exceptional 6.8% |
| Comanche | 94.8 /100 | #120 | Exceptional 6.8% |
| Immigrants | Germany | 94.7 /100 | #121 | Exceptional 6.8% |
| Immigrants | Nicaragua | 94.7 /100 | #122 | Exceptional 6.8% |
| Immigrants | Immigrants | 94.6 /100 | #123 | Exceptional 6.8% |
| Immigrants | Asia | 94.4 /100 | #124 | Exceptional 6.8% |
| Austrians | 94.1 /100 | #125 | Exceptional 6.8% |
| Belgians | 94.1 /100 | #126 | Exceptional 6.8% |
| Immigrants | Korea | 93.8 /100 | #127 | Exceptional 6.8% |
| Immigrants | Bolivia | 92.5 /100 | #128 | Exceptional 6.7% |
| Immigrants | England | 92.0 /100 | #129 | Exceptional 6.7% |
| Immigrants | Scotland | 89.0 /100 | #130 | Excellent 6.7% |