Immigrants from Ghana vs Basque 4 or more Vehicles in Household
COMPARE
Immigrants from Ghana
Basque
4 or more Vehicles in Household
4 or more Vehicles in Household Comparison
Immigrants from Ghana
Basques
5.2%
4 OR MORE VEHICLES IN HOUSEHOLD
0.1/ 100
METRIC RATING
299th/ 347
METRIC RANK
8.4%
4 OR MORE VEHICLES IN HOUSEHOLD
100.0/ 100
METRIC RATING
25th/ 347
METRIC RANK
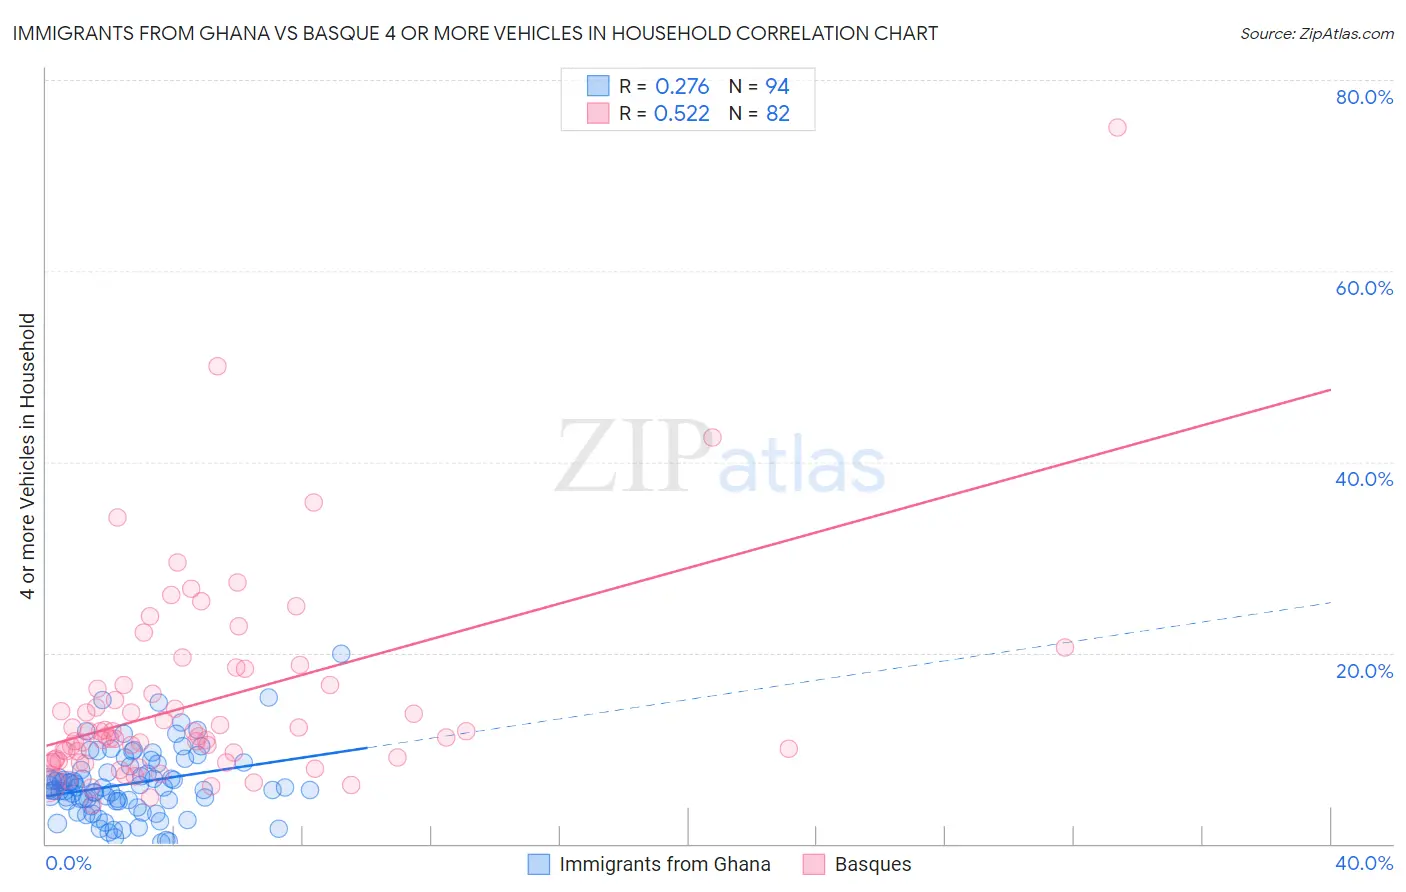
Immigrants from Ghana vs Basque 4 or more Vehicles in Household Correlation Chart
The statistical analysis conducted on geographies consisting of 198,971,687 people shows a weak positive correlation between the proportion of Immigrants from Ghana and percentage of households with 4 or more vehicles available in the United States with a correlation coefficient (R) of 0.276 and weighted average of 5.2%. Similarly, the statistical analysis conducted on geographies consisting of 165,472,258 people shows a substantial positive correlation between the proportion of Basques and percentage of households with 4 or more vehicles available in the United States with a correlation coefficient (R) of 0.522 and weighted average of 8.4%, a difference of 63.0%.
4 or more Vehicles in Household Correlation Summary
| Measurement | Immigrants from Ghana | Basque |
| Minimum | 0.17% | 4.1% |
| Maximum | 19.9% | 75.0% |
| Range | 19.8% | 70.9% |
| Mean | 6.3% | 14.8% |
| Median | 5.9% | 11.3% |
| Interquartile 25% (IQ1) | 4.4% | 8.7% |
| Interquartile 75% (IQ3) | 8.1% | 16.6% |
| Interquartile Range (IQR) | 3.6% | 7.8% |
| Standard Deviation (Sample) | 3.6% | 10.7% |
| Standard Deviation (Population) | 3.5% | 10.7% |
Similar Demographics by 4 or more Vehicles in Household
Demographics Similar to Immigrants from Ghana by 4 or more Vehicles in Household
In terms of 4 or more vehicles in household, the demographic groups most similar to Immigrants from Ghana are Immigrants from South America (5.2%, a difference of 0.46%), Immigrants from Venezuela (5.2%, a difference of 0.79%), Israeli (5.2%, a difference of 1.1%), Immigrants from Brazil (5.2%, a difference of 1.3%), and Ghanaian (5.2%, a difference of 1.4%).
| Demographics | Rating | Rank | 4 or more Vehicles in Household |
| Liberians | 0.1 /100 | #292 | Tragic 5.3% |
| Immigrants | Congo | 0.1 /100 | #293 | Tragic 5.2% |
| Ghanaians | 0.1 /100 | #294 | Tragic 5.2% |
| Immigrants | Brazil | 0.1 /100 | #295 | Tragic 5.2% |
| Israelis | 0.1 /100 | #296 | Tragic 5.2% |
| Immigrants | Venezuela | 0.1 /100 | #297 | Tragic 5.2% |
| Immigrants | South America | 0.1 /100 | #298 | Tragic 5.2% |
| Immigrants | Ghana | 0.1 /100 | #299 | Tragic 5.2% |
| Immigrants | Morocco | 0.0 /100 | #300 | Tragic 5.1% |
| Immigrants | Zaire | 0.0 /100 | #301 | Tragic 5.1% |
| Bahamians | 0.0 /100 | #302 | Tragic 5.1% |
| Immigrants | Greece | 0.0 /100 | #303 | Tragic 5.1% |
| Cypriots | 0.0 /100 | #304 | Tragic 5.0% |
| Somalis | 0.0 /100 | #305 | Tragic 5.0% |
| Immigrants | Serbia | 0.0 /100 | #306 | Tragic 5.0% |
Demographics Similar to Basques by 4 or more Vehicles in Household
In terms of 4 or more vehicles in household, the demographic groups most similar to Basques are Mexican American Indian (8.4%, a difference of 0.31%), Sri Lankan (8.4%, a difference of 0.43%), Immigrants from Central America (8.5%, a difference of 0.54%), Immigrants from Philippines (8.5%, a difference of 1.4%), and Immigrants from Vietnam (8.6%, a difference of 1.6%).
| Demographics | Rating | Rank | 4 or more Vehicles in Household |
| Nepalese | 100.0 /100 | #18 | Exceptional 8.7% |
| Koreans | 100.0 /100 | #19 | Exceptional 8.6% |
| Pueblo | 100.0 /100 | #20 | Exceptional 8.6% |
| Danes | 100.0 /100 | #21 | Exceptional 8.6% |
| Immigrants | Vietnam | 100.0 /100 | #22 | Exceptional 8.6% |
| Immigrants | Philippines | 100.0 /100 | #23 | Exceptional 8.5% |
| Immigrants | Central America | 100.0 /100 | #24 | Exceptional 8.5% |
| Basques | 100.0 /100 | #25 | Exceptional 8.4% |
| Mexican American Indians | 100.0 /100 | #26 | Exceptional 8.4% |
| Sri Lankans | 100.0 /100 | #27 | Exceptional 8.4% |
| Cheyenne | 100.0 /100 | #28 | Exceptional 8.3% |
| Immigrants | South Eastern Asia | 100.0 /100 | #29 | Exceptional 8.2% |
| Navajo | 100.0 /100 | #30 | Exceptional 8.2% |
| Natives/Alaskans | 100.0 /100 | #31 | Exceptional 8.2% |
| Marshallese | 100.0 /100 | #32 | Exceptional 8.1% |