Immigrants from Bolivia vs Immigrants 4 or more Vehicles in Household
COMPARE
Immigrants from Bolivia
Immigrants
4 or more Vehicles in Household
4 or more Vehicles in Household Comparison
Immigrants from Bolivia
Immigrants
6.7%
4 OR MORE VEHICLES IN HOUSEHOLD
92.5/ 100
METRIC RATING
128th/ 347
METRIC RANK
6.8%
4 OR MORE VEHICLES IN HOUSEHOLD
94.6/ 100
METRIC RATING
123rd/ 347
METRIC RANK
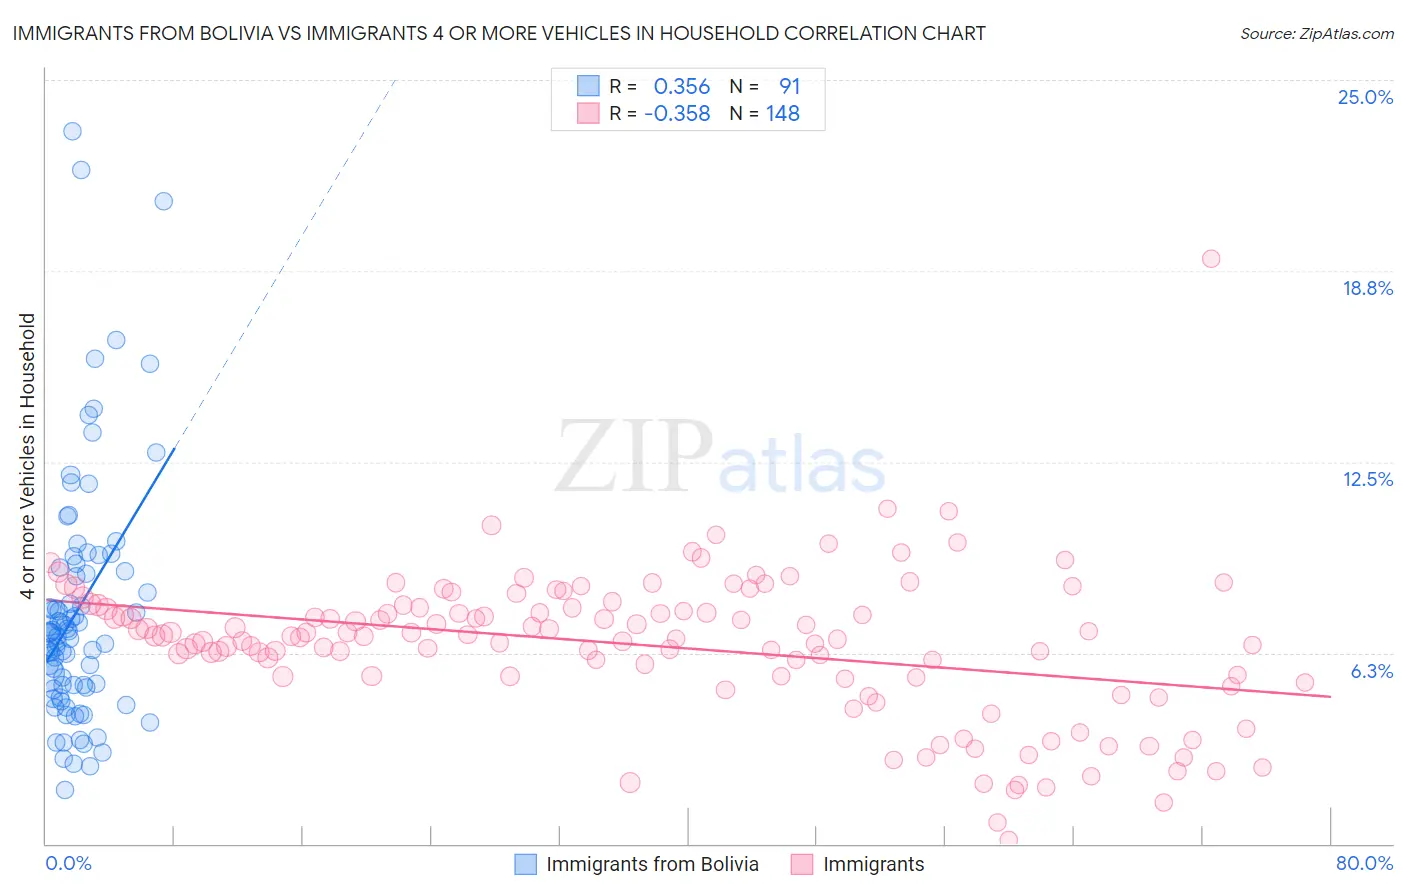
Immigrants from Bolivia vs Immigrants 4 or more Vehicles in Household Correlation Chart
The statistical analysis conducted on geographies consisting of 158,274,553 people shows a mild positive correlation between the proportion of Immigrants from Bolivia and percentage of households with 4 or more vehicles available in the United States with a correlation coefficient (R) of 0.356 and weighted average of 6.7%. Similarly, the statistical analysis conducted on geographies consisting of 573,807,662 people shows a mild negative correlation between the proportion of Immigrants and percentage of households with 4 or more vehicles available in the United States with a correlation coefficient (R) of -0.358 and weighted average of 6.8%, a difference of 0.82%.
4 or more Vehicles in Household Correlation Summary
| Measurement | Immigrants from Bolivia | Immigrants |
| Minimum | 1.8% | 0.13% |
| Maximum | 23.3% | 19.1% |
| Range | 21.6% | 19.0% |
| Mean | 7.7% | 6.5% |
| Median | 6.9% | 6.8% |
| Interquartile 25% (IQ1) | 5.1% | 5.5% |
| Interquartile 75% (IQ3) | 9.0% | 7.8% |
| Interquartile Range (IQR) | 3.9% | 2.3% |
| Standard Deviation (Sample) | 4.1% | 2.4% |
| Standard Deviation (Population) | 4.1% | 2.4% |
Demographics Similar to Immigrants from Bolivia and Immigrants by 4 or more Vehicles in Household
In terms of 4 or more vehicles in household, the demographic groups most similar to Immigrants from Bolivia are Immigrants from England (6.7%, a difference of 0.16%), Immigrants from Korea (6.8%, a difference of 0.50%), Belgian (6.8%, a difference of 0.62%), Austrian (6.8%, a difference of 0.63%), and Immigrants from Asia (6.8%, a difference of 0.72%). Similarly, the demographic groups most similar to Immigrants are Immigrants from Nicaragua (6.8%, a difference of 0.060%), Immigrants from Germany (6.8%, a difference of 0.070%), Immigrants from Asia (6.8%, a difference of 0.10%), Comanche (6.8%, a difference of 0.13%), and Austrian (6.8%, a difference of 0.19%).
| Demographics | Rating | Rank | 4 or more Vehicles in Household |
| Tlingit-Haida | 96.2 /100 | #115 | Exceptional 6.8% |
| Immigrants | Guatemala | 95.8 /100 | #116 | Exceptional 6.8% |
| Burmese | 95.7 /100 | #117 | Exceptional 6.8% |
| French American Indians | 95.7 /100 | #118 | Exceptional 6.8% |
| Costa Ricans | 95.5 /100 | #119 | Exceptional 6.8% |
| Comanche | 94.8 /100 | #120 | Exceptional 6.8% |
| Immigrants | Germany | 94.7 /100 | #121 | Exceptional 6.8% |
| Immigrants | Nicaragua | 94.7 /100 | #122 | Exceptional 6.8% |
| Immigrants | Immigrants | 94.6 /100 | #123 | Exceptional 6.8% |
| Immigrants | Asia | 94.4 /100 | #124 | Exceptional 6.8% |
| Austrians | 94.1 /100 | #125 | Exceptional 6.8% |
| Belgians | 94.1 /100 | #126 | Exceptional 6.8% |
| Immigrants | Korea | 93.8 /100 | #127 | Exceptional 6.8% |
| Immigrants | Bolivia | 92.5 /100 | #128 | Exceptional 6.7% |
| Immigrants | England | 92.0 /100 | #129 | Exceptional 6.7% |
| Immigrants | Scotland | 89.0 /100 | #130 | Excellent 6.7% |
| Maltese | 88.4 /100 | #131 | Excellent 6.7% |
| Immigrants | Netherlands | 87.8 /100 | #132 | Excellent 6.6% |
| Armenians | 86.9 /100 | #133 | Excellent 6.6% |
| Ottawa | 86.9 /100 | #134 | Excellent 6.6% |
| Tohono O'odham | 86.7 /100 | #135 | Excellent 6.6% |