Immigrants from Ghana vs Immigrants from Kenya 4 or more Vehicles in Household
COMPARE
Immigrants from Ghana
Immigrants from Kenya
4 or more Vehicles in Household
4 or more Vehicles in Household Comparison
Immigrants from Ghana
Immigrants from Kenya
5.2%
4 OR MORE VEHICLES IN HOUSEHOLD
0.1/ 100
METRIC RATING
299th/ 347
METRIC RANK
6.0%
4 OR MORE VEHICLES IN HOUSEHOLD
9.2/ 100
METRIC RATING
223rd/ 347
METRIC RANK
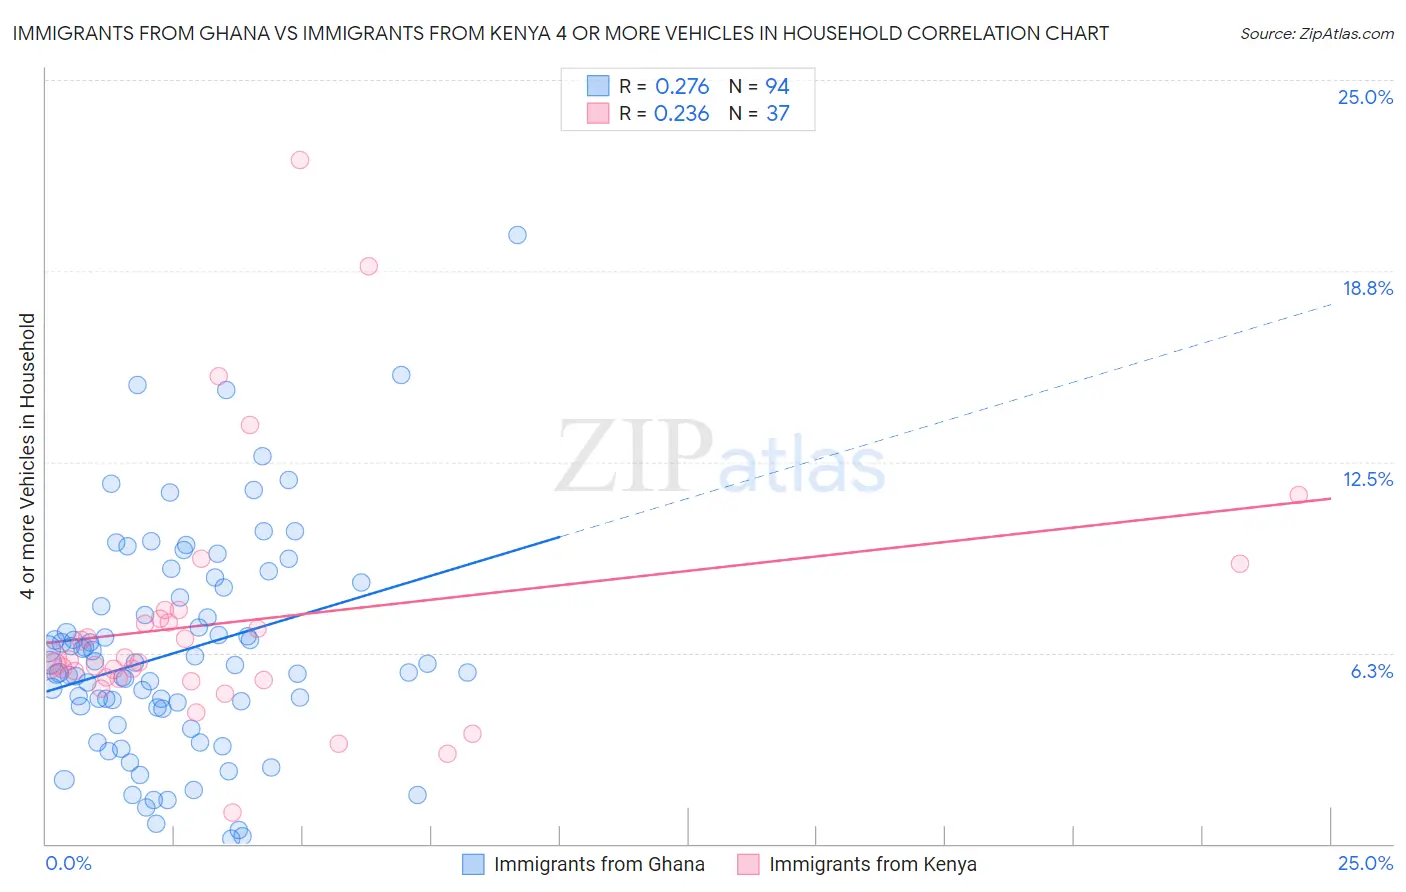
Immigrants from Ghana vs Immigrants from Kenya 4 or more Vehicles in Household Correlation Chart
The statistical analysis conducted on geographies consisting of 198,971,687 people shows a weak positive correlation between the proportion of Immigrants from Ghana and percentage of households with 4 or more vehicles available in the United States with a correlation coefficient (R) of 0.276 and weighted average of 5.2%. Similarly, the statistical analysis conducted on geographies consisting of 217,337,242 people shows a weak positive correlation between the proportion of Immigrants from Kenya and percentage of households with 4 or more vehicles available in the United States with a correlation coefficient (R) of 0.236 and weighted average of 6.0%, a difference of 15.1%.
4 or more Vehicles in Household Correlation Summary
| Measurement | Immigrants from Ghana | Immigrants from Kenya |
| Minimum | 0.17% | 1.0% |
| Maximum | 19.9% | 22.4% |
| Range | 19.8% | 21.3% |
| Mean | 6.3% | 7.3% |
| Median | 5.9% | 6.0% |
| Interquartile 25% (IQ1) | 4.4% | 5.4% |
| Interquartile 75% (IQ3) | 8.1% | 7.5% |
| Interquartile Range (IQR) | 3.6% | 2.1% |
| Standard Deviation (Sample) | 3.6% | 4.2% |
| Standard Deviation (Population) | 3.5% | 4.1% |
Similar Demographics by 4 or more Vehicles in Household
Demographics Similar to Immigrants from Ghana by 4 or more Vehicles in Household
In terms of 4 or more vehicles in household, the demographic groups most similar to Immigrants from Ghana are Immigrants from South America (5.2%, a difference of 0.46%), Immigrants from Venezuela (5.2%, a difference of 0.79%), Israeli (5.2%, a difference of 1.1%), Immigrants from Brazil (5.2%, a difference of 1.3%), and Ghanaian (5.2%, a difference of 1.4%).
| Demographics | Rating | Rank | 4 or more Vehicles in Household |
| Liberians | 0.1 /100 | #292 | Tragic 5.3% |
| Immigrants | Congo | 0.1 /100 | #293 | Tragic 5.2% |
| Ghanaians | 0.1 /100 | #294 | Tragic 5.2% |
| Immigrants | Brazil | 0.1 /100 | #295 | Tragic 5.2% |
| Israelis | 0.1 /100 | #296 | Tragic 5.2% |
| Immigrants | Venezuela | 0.1 /100 | #297 | Tragic 5.2% |
| Immigrants | South America | 0.1 /100 | #298 | Tragic 5.2% |
| Immigrants | Ghana | 0.1 /100 | #299 | Tragic 5.2% |
| Immigrants | Morocco | 0.0 /100 | #300 | Tragic 5.1% |
| Immigrants | Zaire | 0.0 /100 | #301 | Tragic 5.1% |
| Bahamians | 0.0 /100 | #302 | Tragic 5.1% |
| Immigrants | Greece | 0.0 /100 | #303 | Tragic 5.1% |
| Cypriots | 0.0 /100 | #304 | Tragic 5.0% |
| Somalis | 0.0 /100 | #305 | Tragic 5.0% |
| Immigrants | Serbia | 0.0 /100 | #306 | Tragic 5.0% |
Demographics Similar to Immigrants from Kenya by 4 or more Vehicles in Household
In terms of 4 or more vehicles in household, the demographic groups most similar to Immigrants from Kenya are Cajun (6.0%, a difference of 0.0%), Cuban (6.0%, a difference of 0.010%), Immigrants from Moldova (6.0%, a difference of 0.030%), Indonesian (6.0%, a difference of 0.090%), and Russian (6.0%, a difference of 0.33%).
| Demographics | Rating | Rank | 4 or more Vehicles in Household |
| Immigrants | Romania | 13.8 /100 | #216 | Poor 6.0% |
| Nigerians | 12.2 /100 | #217 | Poor 6.0% |
| Immigrants | Italy | 11.0 /100 | #218 | Poor 6.0% |
| Serbians | 11.0 /100 | #219 | Poor 6.0% |
| Russians | 10.3 /100 | #220 | Poor 6.0% |
| Immigrants | Moldova | 9.3 /100 | #221 | Tragic 6.0% |
| Cajuns | 9.2 /100 | #222 | Tragic 6.0% |
| Immigrants | Kenya | 9.2 /100 | #223 | Tragic 6.0% |
| Cubans | 9.2 /100 | #224 | Tragic 6.0% |
| Indonesians | 8.9 /100 | #225 | Tragic 6.0% |
| Immigrants | Singapore | 7.9 /100 | #226 | Tragic 5.9% |
| Immigrants | Western Asia | 7.8 /100 | #227 | Tragic 5.9% |
| Immigrants | Uganda | 7.5 /100 | #228 | Tragic 5.9% |
| Eastern Europeans | 6.8 /100 | #229 | Tragic 5.9% |
| Immigrants | Malaysia | 6.7 /100 | #230 | Tragic 5.9% |