Immigrants from Ghana vs Immigrants Householder Income Ages 25 - 44 years
COMPARE
Immigrants from Ghana
Immigrants
Householder Income Ages 25 - 44 years
Householder Income Ages 25 - 44 years Comparison
Immigrants from Ghana
Immigrants
$87,760
HOUSEHOLDER INCOME AGES 25 - 44 YEARS
2.2/ 100
METRIC RATING
239th/ 347
METRIC RANK
$94,423
HOUSEHOLDER INCOME AGES 25 - 44 YEARS
48.0/ 100
METRIC RATING
176th/ 347
METRIC RANK
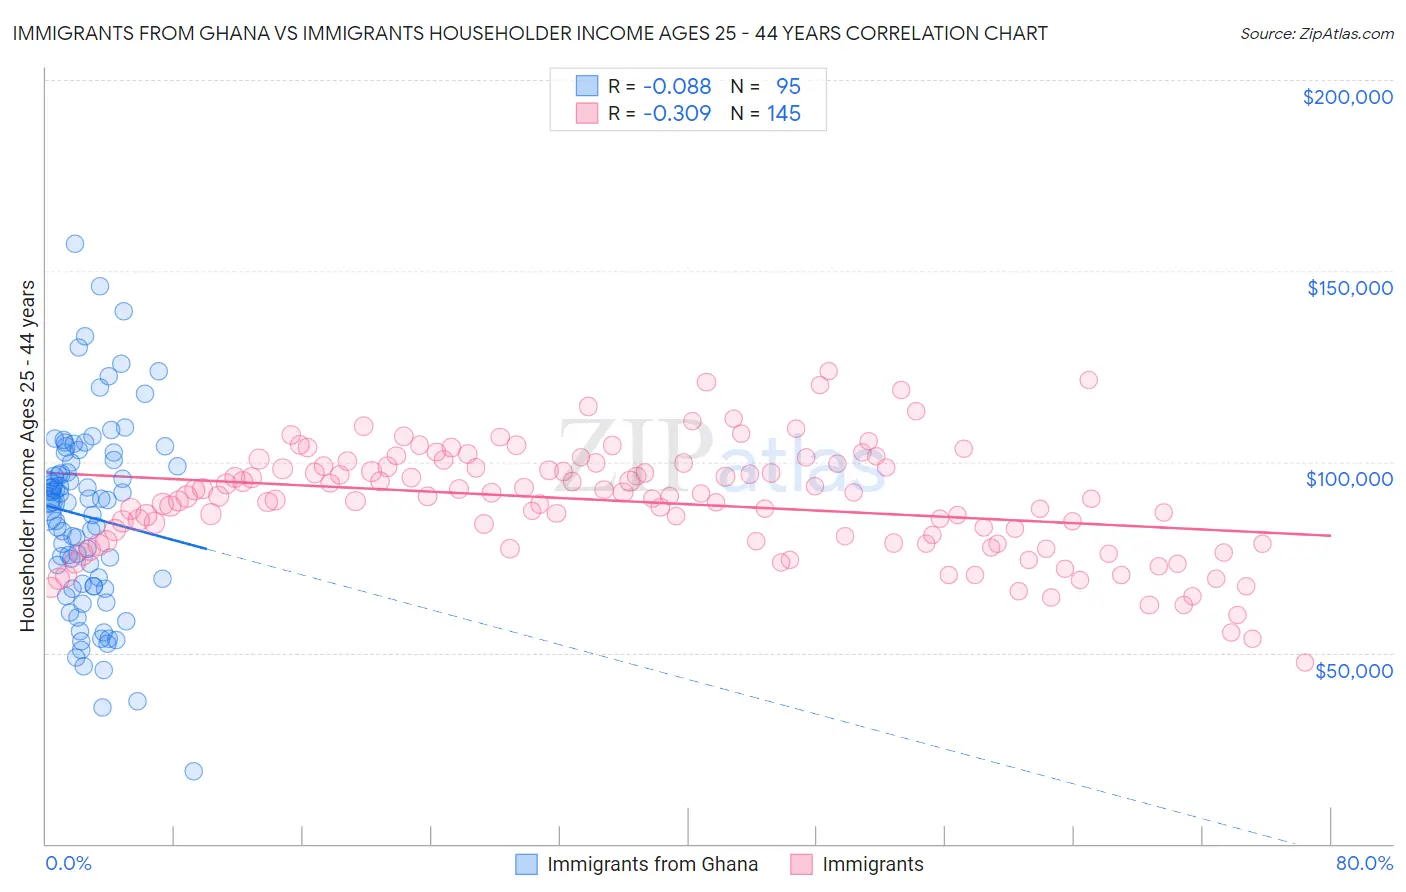
Immigrants from Ghana vs Immigrants Householder Income Ages 25 - 44 years Correlation Chart
The statistical analysis conducted on geographies consisting of 199,650,351 people shows a slight negative correlation between the proportion of Immigrants from Ghana and household income with householder between the ages 25 and 44 in the United States with a correlation coefficient (R) of -0.088 and weighted average of $87,760. Similarly, the statistical analysis conducted on geographies consisting of 570,849,729 people shows a mild negative correlation between the proportion of Immigrants and household income with householder between the ages 25 and 44 in the United States with a correlation coefficient (R) of -0.309 and weighted average of $94,423, a difference of 7.6%.
Householder Income Ages 25 - 44 years Correlation Summary
| Measurement | Immigrants from Ghana | Immigrants |
| Minimum | $18,980 | $47,510 |
| Maximum | $157,070 | $123,721 |
| Range | $138,090 | $76,211 |
| Mean | $85,645 | $89,554 |
| Median | $89,488 | $91,017 |
| Interquartile 25% (IQ1) | $67,346 | $78,698 |
| Interquartile 75% (IQ3) | $100,333 | $99,239 |
| Interquartile Range (IQR) | $32,987 | $20,541 |
| Standard Deviation (Sample) | $24,889 | $14,494 |
| Standard Deviation (Population) | $24,757 | $14,444 |
Similar Demographics by Householder Income Ages 25 - 44 years
Demographics Similar to Immigrants from Ghana by Householder Income Ages 25 - 44 years
In terms of householder income ages 25 - 44 years, the demographic groups most similar to Immigrants from Ghana are Nicaraguan ($87,751, a difference of 0.010%), Nigerian ($87,730, a difference of 0.030%), Alaska Native ($88,018, a difference of 0.29%), Salvadoran ($88,198, a difference of 0.50%), and Immigrants from Cameroon ($88,214, a difference of 0.52%).
| Demographics | Rating | Rank | Householder Income Ages 25 - 44 years |
| Immigrants | Nonimmigrants | 3.0 /100 | #232 | Tragic $88,301 |
| Malaysians | 3.0 /100 | #233 | Tragic $88,291 |
| Venezuelans | 2.9 /100 | #234 | Tragic $88,232 |
| Bermudans | 2.9 /100 | #235 | Tragic $88,231 |
| Immigrants | Cameroon | 2.9 /100 | #236 | Tragic $88,214 |
| Salvadorans | 2.8 /100 | #237 | Tragic $88,198 |
| Alaska Natives | 2.6 /100 | #238 | Tragic $88,018 |
| Immigrants | Ghana | 2.2 /100 | #239 | Tragic $87,760 |
| Nicaraguans | 2.2 /100 | #240 | Tragic $87,751 |
| Nigerians | 2.2 /100 | #241 | Tragic $87,730 |
| West Indians | 1.7 /100 | #242 | Tragic $87,205 |
| Immigrants | West Indies | 1.5 /100 | #243 | Tragic $87,063 |
| Immigrants | Venezuela | 1.5 /100 | #244 | Tragic $87,038 |
| Immigrants | El Salvador | 1.4 /100 | #245 | Tragic $86,913 |
| Immigrants | Burma/Myanmar | 1.3 /100 | #246 | Tragic $86,736 |
Demographics Similar to Immigrants by Householder Income Ages 25 - 44 years
In terms of householder income ages 25 - 44 years, the demographic groups most similar to Immigrants are English ($94,429, a difference of 0.010%), Colombian ($94,565, a difference of 0.15%), Belgian ($94,262, a difference of 0.17%), Finnish ($94,610, a difference of 0.20%), and Scottish ($94,622, a difference of 0.21%).
| Demographics | Rating | Rank | Householder Income Ages 25 - 44 years |
| Native Hawaiians | 56.8 /100 | #169 | Average $95,058 |
| Slovaks | 56.4 /100 | #170 | Average $95,032 |
| Immigrants | Armenia | 54.2 /100 | #171 | Average $94,867 |
| Scottish | 50.8 /100 | #172 | Average $94,622 |
| Finns | 50.6 /100 | #173 | Average $94,610 |
| Colombians | 50.0 /100 | #174 | Average $94,565 |
| English | 48.1 /100 | #175 | Average $94,429 |
| Immigrants | Immigrants | 48.0 /100 | #176 | Average $94,423 |
| Belgians | 45.8 /100 | #177 | Average $94,262 |
| Immigrants | South America | 42.8 /100 | #178 | Average $94,042 |
| French Canadians | 38.2 /100 | #179 | Fair $93,694 |
| French | 37.8 /100 | #180 | Fair $93,665 |
| Puget Sound Salish | 37.7 /100 | #181 | Fair $93,661 |
| Uruguayans | 37.3 /100 | #182 | Fair $93,631 |
| Guamanians/Chamorros | 36.5 /100 | #183 | Fair $93,569 |