Slovak vs Immigrants 4 or more Vehicles in Household
COMPARE
Slovak
Immigrants
4 or more Vehicles in Household
4 or more Vehicles in Household Comparison
Slovaks
Immigrants
6.3%
4 OR MORE VEHICLES IN HOUSEHOLD
46.9/ 100
METRIC RATING
177th/ 347
METRIC RANK
6.8%
4 OR MORE VEHICLES IN HOUSEHOLD
94.6/ 100
METRIC RATING
123rd/ 347
METRIC RANK
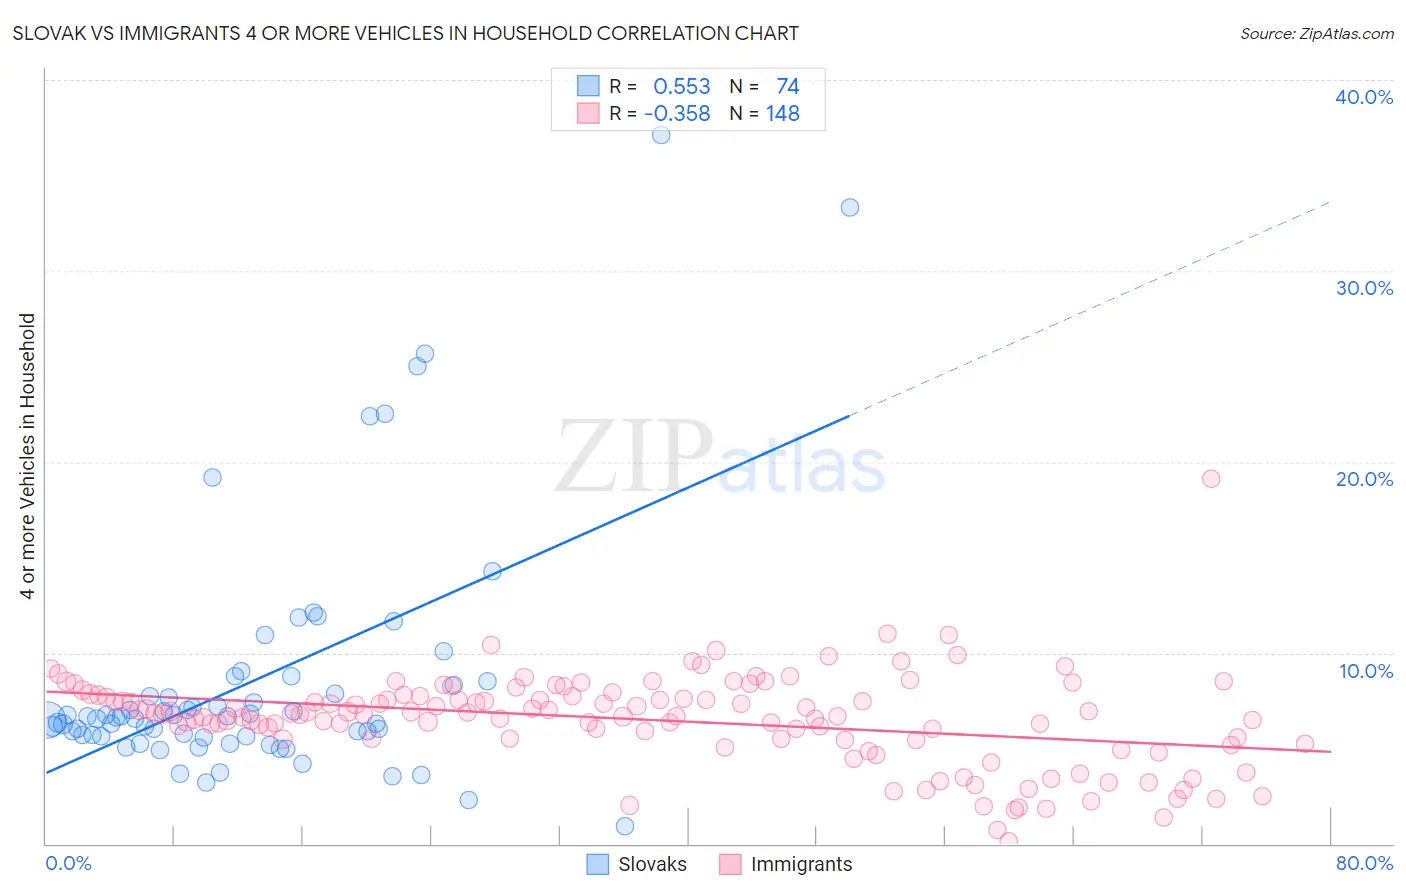
Slovak vs Immigrants 4 or more Vehicles in Household Correlation Chart
The statistical analysis conducted on geographies consisting of 396,389,671 people shows a substantial positive correlation between the proportion of Slovaks and percentage of households with 4 or more vehicles available in the United States with a correlation coefficient (R) of 0.553 and weighted average of 6.3%. Similarly, the statistical analysis conducted on geographies consisting of 573,807,662 people shows a mild negative correlation between the proportion of Immigrants and percentage of households with 4 or more vehicles available in the United States with a correlation coefficient (R) of -0.358 and weighted average of 6.8%, a difference of 7.6%.
4 or more Vehicles in Household Correlation Summary
| Measurement | Slovak | Immigrants |
| Minimum | 0.89% | 0.13% |
| Maximum | 37.1% | 19.1% |
| Range | 36.2% | 19.0% |
| Mean | 8.5% | 6.5% |
| Median | 6.6% | 6.8% |
| Interquartile 25% (IQ1) | 5.6% | 5.5% |
| Interquartile 75% (IQ3) | 8.3% | 7.8% |
| Interquartile Range (IQR) | 2.7% | 2.3% |
| Standard Deviation (Sample) | 6.5% | 2.4% |
| Standard Deviation (Population) | 6.5% | 2.4% |
Similar Demographics by 4 or more Vehicles in Household
Demographics Similar to Slovaks by 4 or more Vehicles in Household
In terms of 4 or more vehicles in household, the demographic groups most similar to Slovaks are Ukrainian (6.3%, a difference of 0.070%), Immigrants from Western Europe (6.3%, a difference of 0.20%), Belizean (6.3%, a difference of 0.24%), Lithuanian (6.3%, a difference of 0.32%), and Immigrants from Japan (6.3%, a difference of 0.39%).
| Demographics | Rating | Rank | 4 or more Vehicles in Household |
| Immigrants | Syria | 52.8 /100 | #170 | Average 6.3% |
| Immigrants | India | 51.9 /100 | #171 | Average 6.3% |
| Immigrants | Lebanon | 51.7 /100 | #172 | Average 6.3% |
| Slovenes | 51.1 /100 | #173 | Average 6.3% |
| Lithuanians | 50.0 /100 | #174 | Average 6.3% |
| Immigrants | Western Europe | 48.8 /100 | #175 | Average 6.3% |
| Ukrainians | 47.6 /100 | #176 | Average 6.3% |
| Slovaks | 46.9 /100 | #177 | Average 6.3% |
| Belizeans | 44.5 /100 | #178 | Average 6.3% |
| Immigrants | Japan | 43.1 /100 | #179 | Average 6.3% |
| Syrians | 42.0 /100 | #180 | Average 6.3% |
| Yugoslavians | 41.1 /100 | #181 | Average 6.3% |
| South American Indians | 40.7 /100 | #182 | Average 6.3% |
| Immigrants | Burma/Myanmar | 37.5 /100 | #183 | Fair 6.2% |
| Iraqis | 37.3 /100 | #184 | Fair 6.2% |
Demographics Similar to Immigrants by 4 or more Vehicles in Household
In terms of 4 or more vehicles in household, the demographic groups most similar to Immigrants are Immigrants from Nicaragua (6.8%, a difference of 0.060%), Immigrants from Germany (6.8%, a difference of 0.070%), Immigrants from Asia (6.8%, a difference of 0.10%), Comanche (6.8%, a difference of 0.13%), and Austrian (6.8%, a difference of 0.19%).
| Demographics | Rating | Rank | 4 or more Vehicles in Household |
| Immigrants | Guatemala | 95.8 /100 | #116 | Exceptional 6.8% |
| Burmese | 95.7 /100 | #117 | Exceptional 6.8% |
| French American Indians | 95.7 /100 | #118 | Exceptional 6.8% |
| Costa Ricans | 95.5 /100 | #119 | Exceptional 6.8% |
| Comanche | 94.8 /100 | #120 | Exceptional 6.8% |
| Immigrants | Germany | 94.7 /100 | #121 | Exceptional 6.8% |
| Immigrants | Nicaragua | 94.7 /100 | #122 | Exceptional 6.8% |
| Immigrants | Immigrants | 94.6 /100 | #123 | Exceptional 6.8% |
| Immigrants | Asia | 94.4 /100 | #124 | Exceptional 6.8% |
| Austrians | 94.1 /100 | #125 | Exceptional 6.8% |
| Belgians | 94.1 /100 | #126 | Exceptional 6.8% |
| Immigrants | Korea | 93.8 /100 | #127 | Exceptional 6.8% |
| Immigrants | Bolivia | 92.5 /100 | #128 | Exceptional 6.7% |
| Immigrants | England | 92.0 /100 | #129 | Exceptional 6.7% |
| Immigrants | Scotland | 89.0 /100 | #130 | Excellent 6.7% |