Immigrants from Ghana vs Immigrants from Nicaragua 2 or more Vehicles in Household
COMPARE
Immigrants from Ghana
Immigrants from Nicaragua
2 or more Vehicles in Household
2 or more Vehicles in Household Comparison
Immigrants from Ghana
Immigrants from Nicaragua
47.4%
2 OR MORE VEHICLES IN HOUSEHOLD
0.0/ 100
METRIC RATING
314th/ 347
METRIC RANK
55.4%
2 OR MORE VEHICLES IN HOUSEHOLD
51.6/ 100
METRIC RATING
172nd/ 347
METRIC RANK
Immigrants from Ghana vs Immigrants from Nicaragua 2 or more Vehicles in Household Correlation Chart
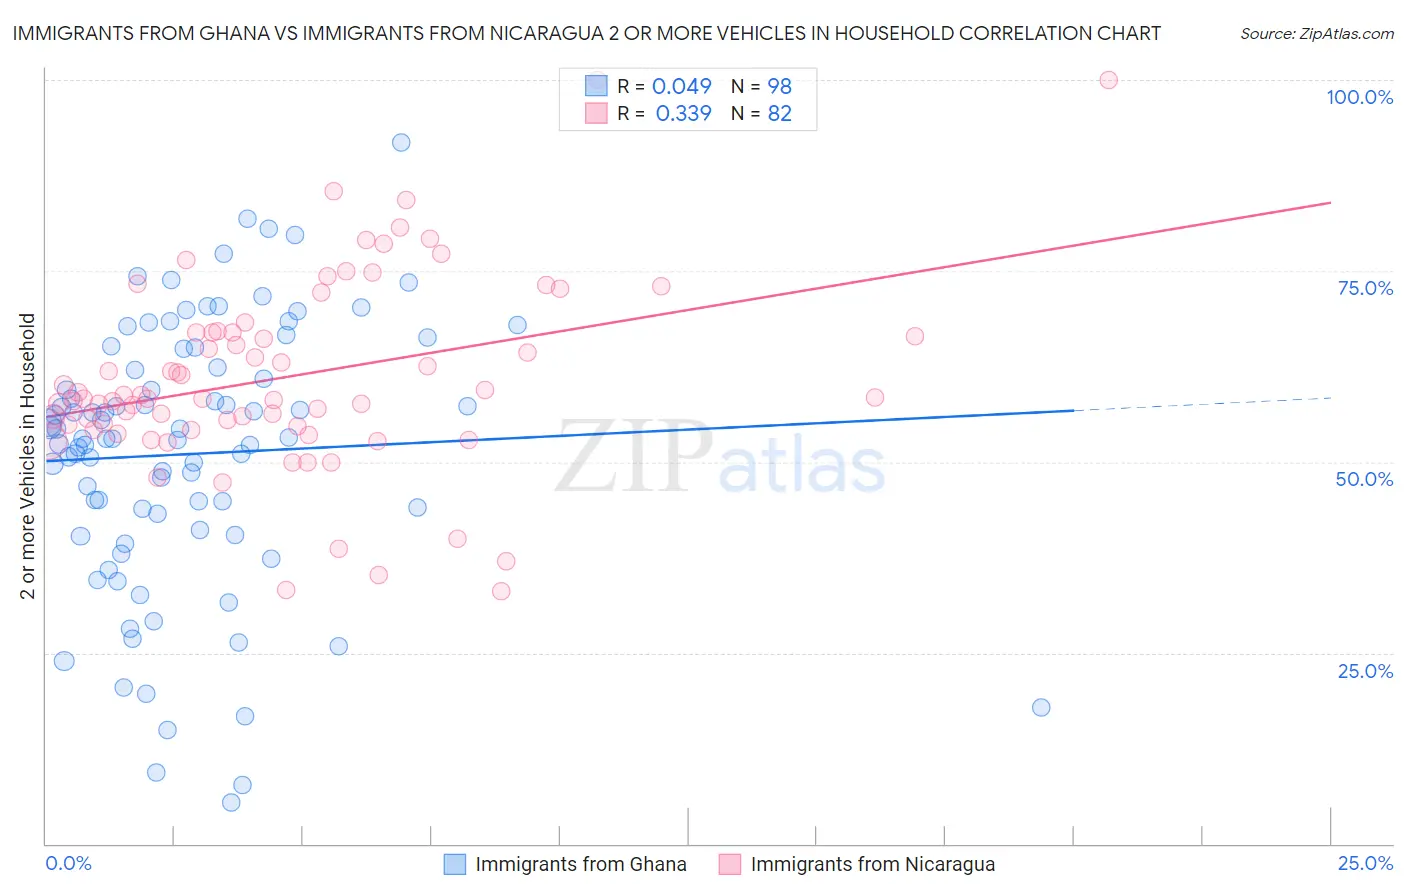
The statistical analysis conducted on geographies consisting of 199,813,535 people shows no correlation between the proportion of Immigrants from Ghana and percentage of households with 2 or more vehicles available in the United States with a correlation coefficient (R) of 0.049 and weighted average of 47.4%. Similarly, the statistical analysis conducted on geographies consisting of 236,314,206 people shows a mild positive correlation between the proportion of Immigrants from Nicaragua and percentage of households with 2 or more vehicles available in the United States with a correlation coefficient (R) of 0.339 and weighted average of 55.4%, a difference of 16.9%.
2 or more Vehicles in Household Correlation Summary
| Measurement | Immigrants from Ghana | Immigrants from Nicaragua |
| Minimum | 5.4% | 33.1% |
| Maximum | 91.9% | 100.0% |
| Range | 86.4% | 66.9% |
| Mean | 51.0% | 61.2% |
| Median | 53.0% | 58.4% |
| Interquartile 25% (IQ1) | 41.0% | 54.6% |
| Interquartile 75% (IQ3) | 62.3% | 66.9% |
| Interquartile Range (IQR) | 21.3% | 12.3% |
| Standard Deviation (Sample) | 17.5% | 12.7% |
| Standard Deviation (Population) | 17.5% | 12.6% |
Similar Demographics by 2 or more Vehicles in Household
Demographics Similar to Immigrants from Ghana by 2 or more Vehicles in Household
In terms of 2 or more vehicles in household, the demographic groups most similar to Immigrants from Ghana are U.S. Virgin Islander (47.5%, a difference of 0.22%), Haitian (47.6%, a difference of 0.40%), Puerto Rican (47.1%, a difference of 0.57%), Immigrants from Belarus (47.9%, a difference of 1.1%), and Ghanaian (48.0%, a difference of 1.3%).
| Demographics | Rating | Rank | 2 or more Vehicles in Household |
| Hopi | 0.0 /100 | #307 | Tragic 49.0% |
| Albanians | 0.0 /100 | #308 | Tragic 49.0% |
| Moroccans | 0.0 /100 | #309 | Tragic 48.8% |
| Ghanaians | 0.0 /100 | #310 | Tragic 48.0% |
| Immigrants | Belarus | 0.0 /100 | #311 | Tragic 47.9% |
| Haitians | 0.0 /100 | #312 | Tragic 47.6% |
| U.S. Virgin Islanders | 0.0 /100 | #313 | Tragic 47.5% |
| Immigrants | Ghana | 0.0 /100 | #314 | Tragic 47.4% |
| Puerto Ricans | 0.0 /100 | #315 | Tragic 47.1% |
| Cape Verdeans | 0.0 /100 | #316 | Tragic 46.8% |
| Immigrants | Haiti | 0.0 /100 | #317 | Tragic 46.5% |
| Immigrants | Albania | 0.0 /100 | #318 | Tragic 46.0% |
| Jamaicans | 0.0 /100 | #319 | Tragic 45.8% |
| Soviet Union | 0.0 /100 | #320 | Tragic 45.7% |
| Immigrants | Jamaica | 0.0 /100 | #321 | Tragic 44.5% |
Demographics Similar to Immigrants from Nicaragua by 2 or more Vehicles in Household
In terms of 2 or more vehicles in household, the demographic groups most similar to Immigrants from Nicaragua are Immigrants from Western Europe (55.4%, a difference of 0.010%), Navajo (55.3%, a difference of 0.070%), Immigrants from Denmark (55.3%, a difference of 0.090%), Immigrants from Costa Rica (55.4%, a difference of 0.11%), and Romanian (55.5%, a difference of 0.17%).
| Demographics | Rating | Rank | 2 or more Vehicles in Household |
| Immigrants | El Salvador | 59.4 /100 | #165 | Average 55.6% |
| Immigrants | Sri Lanka | 58.3 /100 | #166 | Average 55.5% |
| Kenyans | 58.1 /100 | #167 | Average 55.5% |
| French American Indians | 56.7 /100 | #168 | Average 55.5% |
| Immigrants | Austria | 56.3 /100 | #169 | Average 55.5% |
| Romanians | 55.8 /100 | #170 | Average 55.5% |
| Immigrants | Costa Rica | 54.4 /100 | #171 | Average 55.4% |
| Immigrants | Nicaragua | 51.6 /100 | #172 | Average 55.4% |
| Immigrants | Western Europe | 51.4 /100 | #173 | Average 55.4% |
| Navajo | 50.0 /100 | #174 | Average 55.3% |
| Immigrants | Denmark | 49.4 /100 | #175 | Average 55.3% |
| Immigrants | Cuba | 47.0 /100 | #176 | Average 55.3% |
| Menominee | 46.2 /100 | #177 | Average 55.3% |
| Immigrants | Sweden | 45.3 /100 | #178 | Average 55.2% |
| Alaskan Athabascans | 42.9 /100 | #179 | Average 55.2% |