Immigrants from Ghana vs Dominican 2 or more Vehicles in Household
COMPARE
Immigrants from Ghana
Dominican
2 or more Vehicles in Household
2 or more Vehicles in Household Comparison
Immigrants from Ghana
Dominicans
47.4%
2 OR MORE VEHICLES IN HOUSEHOLD
0.0/ 100
METRIC RATING
314th/ 347
METRIC RANK
35.3%
2 OR MORE VEHICLES IN HOUSEHOLD
0.0/ 100
METRIC RATING
342nd/ 347
METRIC RANK
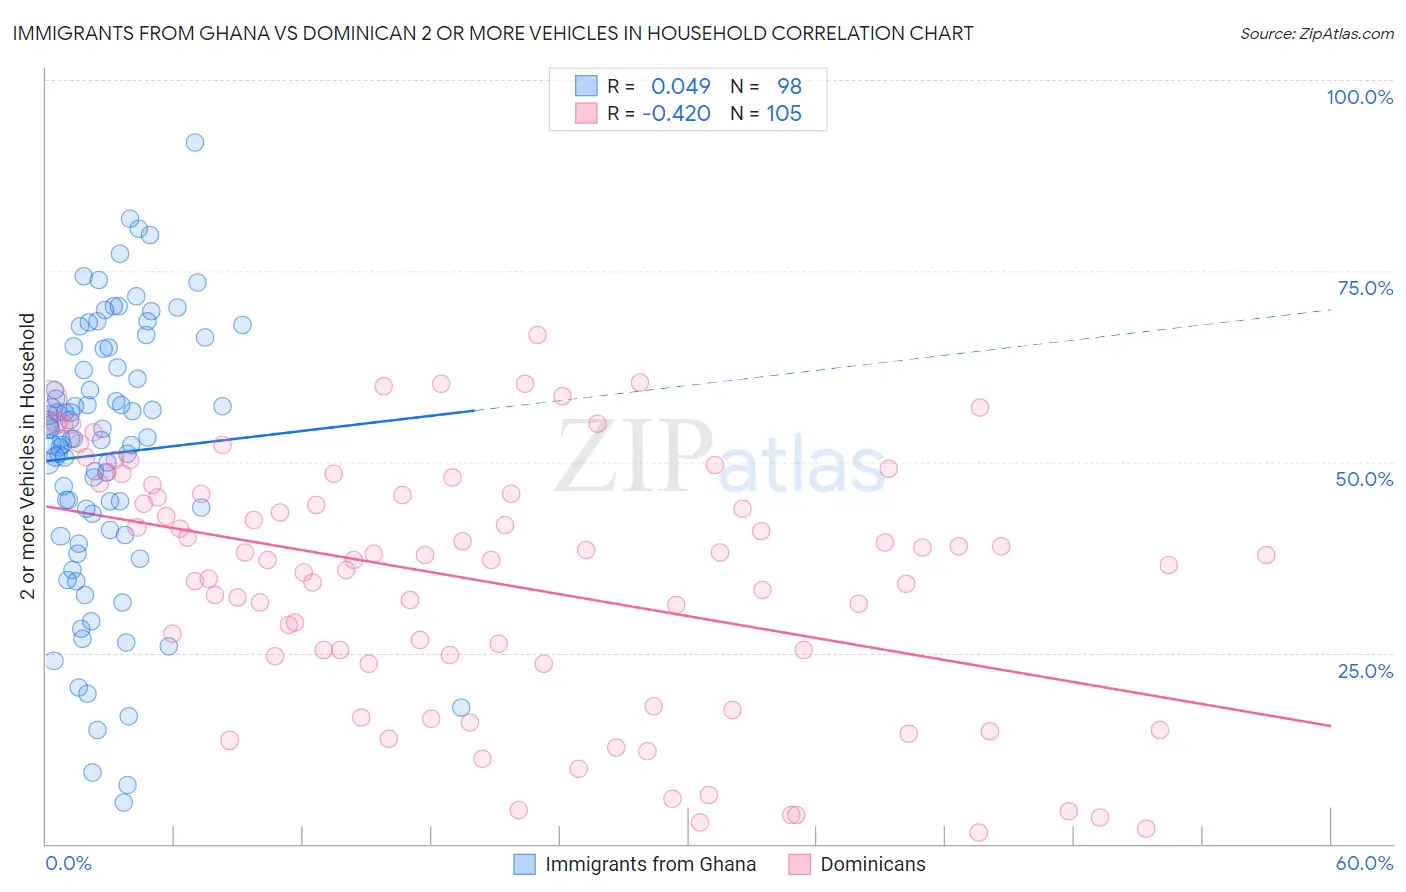
Immigrants from Ghana vs Dominican 2 or more Vehicles in Household Correlation Chart
The statistical analysis conducted on geographies consisting of 199,813,535 people shows no correlation between the proportion of Immigrants from Ghana and percentage of households with 2 or more vehicles available in the United States with a correlation coefficient (R) of 0.049 and weighted average of 47.4%. Similarly, the statistical analysis conducted on geographies consisting of 354,794,588 people shows a moderate negative correlation between the proportion of Dominicans and percentage of households with 2 or more vehicles available in the United States with a correlation coefficient (R) of -0.420 and weighted average of 35.3%, a difference of 34.1%.
2 or more Vehicles in Household Correlation Summary
| Measurement | Immigrants from Ghana | Dominican |
| Minimum | 5.4% | 1.5% |
| Maximum | 91.9% | 66.7% |
| Range | 86.4% | 65.2% |
| Mean | 51.0% | 34.3% |
| Median | 53.0% | 37.2% |
| Interquartile 25% (IQ1) | 41.0% | 24.0% |
| Interquartile 75% (IQ3) | 62.3% | 46.4% |
| Interquartile Range (IQR) | 21.3% | 22.4% |
| Standard Deviation (Sample) | 17.5% | 16.4% |
| Standard Deviation (Population) | 17.5% | 16.3% |
Similar Demographics by 2 or more Vehicles in Household
Demographics Similar to Immigrants from Ghana by 2 or more Vehicles in Household
In terms of 2 or more vehicles in household, the demographic groups most similar to Immigrants from Ghana are U.S. Virgin Islander (47.5%, a difference of 0.22%), Haitian (47.6%, a difference of 0.40%), Puerto Rican (47.1%, a difference of 0.57%), Immigrants from Belarus (47.9%, a difference of 1.1%), and Ghanaian (48.0%, a difference of 1.3%).
| Demographics | Rating | Rank | 2 or more Vehicles in Household |
| Hopi | 0.0 /100 | #307 | Tragic 49.0% |
| Albanians | 0.0 /100 | #308 | Tragic 49.0% |
| Moroccans | 0.0 /100 | #309 | Tragic 48.8% |
| Ghanaians | 0.0 /100 | #310 | Tragic 48.0% |
| Immigrants | Belarus | 0.0 /100 | #311 | Tragic 47.9% |
| Haitians | 0.0 /100 | #312 | Tragic 47.6% |
| U.S. Virgin Islanders | 0.0 /100 | #313 | Tragic 47.5% |
| Immigrants | Ghana | 0.0 /100 | #314 | Tragic 47.4% |
| Puerto Ricans | 0.0 /100 | #315 | Tragic 47.1% |
| Cape Verdeans | 0.0 /100 | #316 | Tragic 46.8% |
| Immigrants | Haiti | 0.0 /100 | #317 | Tragic 46.5% |
| Immigrants | Albania | 0.0 /100 | #318 | Tragic 46.0% |
| Jamaicans | 0.0 /100 | #319 | Tragic 45.8% |
| Soviet Union | 0.0 /100 | #320 | Tragic 45.7% |
| Immigrants | Jamaica | 0.0 /100 | #321 | Tragic 44.5% |
Demographics Similar to Dominicans by 2 or more Vehicles in Household
In terms of 2 or more vehicles in household, the demographic groups most similar to Dominicans are Guyanese (35.4%, a difference of 0.18%), British West Indian (35.4%, a difference of 0.25%), Immigrants from Guyana (35.0%, a difference of 0.89%), Yup'ik (34.9%, a difference of 1.1%), and Immigrants from Barbados (35.8%, a difference of 1.3%).
| Demographics | Rating | Rank | 2 or more Vehicles in Household |
| Immigrants | Ecuador | 0.0 /100 | #333 | Tragic 40.5% |
| Immigrants | Trinidad and Tobago | 0.0 /100 | #334 | Tragic 40.3% |
| Immigrants | Bangladesh | 0.0 /100 | #335 | Tragic 38.8% |
| Vietnamese | 0.0 /100 | #336 | Tragic 38.5% |
| Barbadians | 0.0 /100 | #337 | Tragic 38.3% |
| Immigrants | Uzbekistan | 0.0 /100 | #338 | Tragic 37.9% |
| Immigrants | Barbados | 0.0 /100 | #339 | Tragic 35.8% |
| British West Indians | 0.0 /100 | #340 | Tragic 35.4% |
| Guyanese | 0.0 /100 | #341 | Tragic 35.4% |
| Dominicans | 0.0 /100 | #342 | Tragic 35.3% |
| Immigrants | Guyana | 0.0 /100 | #343 | Tragic 35.0% |
| Yup'ik | 0.0 /100 | #344 | Tragic 34.9% |
| Immigrants | Dominican Republic | 0.0 /100 | #345 | Tragic 33.2% |
| Immigrants | St. Vincent and the Grenadines | 0.0 /100 | #346 | Tragic 31.0% |
| Immigrants | Grenada | 0.0 /100 | #347 | Tragic 28.7% |