Immigrants from Ghana vs Immigrants from Trinidad and Tobago 2 or more Vehicles in Household
COMPARE
Immigrants from Ghana
Immigrants from Trinidad and Tobago
2 or more Vehicles in Household
2 or more Vehicles in Household Comparison
Immigrants from Ghana
Immigrants from Trinidad and Tobago
47.4%
2 OR MORE VEHICLES IN HOUSEHOLD
0.0/ 100
METRIC RATING
314th/ 347
METRIC RANK
40.3%
2 OR MORE VEHICLES IN HOUSEHOLD
0.0/ 100
METRIC RATING
334th/ 347
METRIC RANK
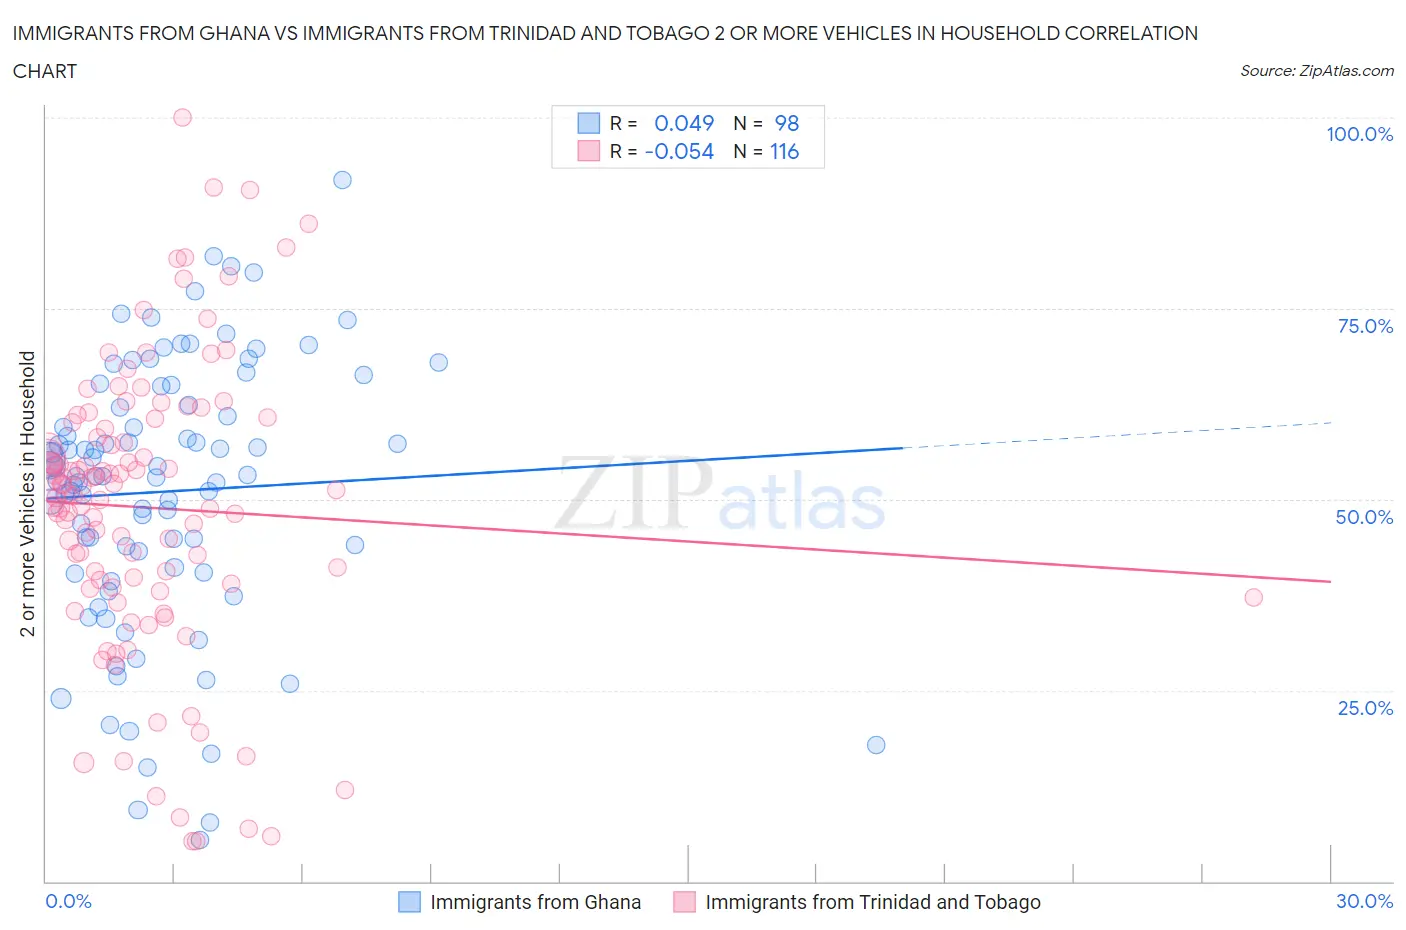
Immigrants from Ghana vs Immigrants from Trinidad and Tobago 2 or more Vehicles in Household Correlation Chart
The statistical analysis conducted on geographies consisting of 199,813,535 people shows no correlation between the proportion of Immigrants from Ghana and percentage of households with 2 or more vehicles available in the United States with a correlation coefficient (R) of 0.049 and weighted average of 47.4%. Similarly, the statistical analysis conducted on geographies consisting of 223,484,323 people shows a slight negative correlation between the proportion of Immigrants from Trinidad and Tobago and percentage of households with 2 or more vehicles available in the United States with a correlation coefficient (R) of -0.054 and weighted average of 40.3%, a difference of 17.6%.
2 or more Vehicles in Household Correlation Summary
| Measurement | Immigrants from Ghana | Immigrants from Trinidad and Tobago |
| Minimum | 5.4% | 5.2% |
| Maximum | 91.9% | 100.0% |
| Range | 86.4% | 94.8% |
| Mean | 51.0% | 48.9% |
| Median | 53.0% | 50.9% |
| Interquartile 25% (IQ1) | 41.0% | 38.7% |
| Interquartile 75% (IQ3) | 62.3% | 59.7% |
| Interquartile Range (IQR) | 21.3% | 20.9% |
| Standard Deviation (Sample) | 17.5% | 18.9% |
| Standard Deviation (Population) | 17.5% | 18.9% |
Demographics Similar to Immigrants from Ghana and Immigrants from Trinidad and Tobago by 2 or more Vehicles in Household
In terms of 2 or more vehicles in household, the demographic groups most similar to Immigrants from Ghana are Puerto Rican (47.1%, a difference of 0.57%), Cape Verdean (46.8%, a difference of 1.3%), Immigrants from Haiti (46.5%, a difference of 1.8%), Immigrants from Albania (46.0%, a difference of 3.0%), and Jamaican (45.8%, a difference of 3.5%). Similarly, the demographic groups most similar to Immigrants from Trinidad and Tobago are Immigrants from Ecuador (40.5%, a difference of 0.58%), Trinidadian and Tobagonian (40.9%, a difference of 1.5%), West Indian (41.3%, a difference of 2.5%), Immigrants from Dominica (41.6%, a difference of 3.4%), and Ecuadorian (42.0%, a difference of 4.2%).
| Demographics | Rating | Rank | 2 or more Vehicles in Household |
| Immigrants | Ghana | 0.0 /100 | #314 | Tragic 47.4% |
| Puerto Ricans | 0.0 /100 | #315 | Tragic 47.1% |
| Cape Verdeans | 0.0 /100 | #316 | Tragic 46.8% |
| Immigrants | Haiti | 0.0 /100 | #317 | Tragic 46.5% |
| Immigrants | Albania | 0.0 /100 | #318 | Tragic 46.0% |
| Jamaicans | 0.0 /100 | #319 | Tragic 45.8% |
| Soviet Union | 0.0 /100 | #320 | Tragic 45.7% |
| Immigrants | Jamaica | 0.0 /100 | #321 | Tragic 44.5% |
| Senegalese | 0.0 /100 | #322 | Tragic 44.2% |
| Immigrants | Caribbean | 0.0 /100 | #323 | Tragic 44.2% |
| Immigrants | Cabo Verde | 0.0 /100 | #324 | Tragic 43.3% |
| Immigrants | West Indies | 0.0 /100 | #325 | Tragic 43.1% |
| Immigrants | Senegal | 0.0 /100 | #326 | Tragic 43.0% |
| Immigrants | Yemen | 0.0 /100 | #327 | Tragic 42.8% |
| Inupiat | 0.0 /100 | #328 | Tragic 42.6% |
| Ecuadorians | 0.0 /100 | #329 | Tragic 42.0% |
| Immigrants | Dominica | 0.0 /100 | #330 | Tragic 41.6% |
| West Indians | 0.0 /100 | #331 | Tragic 41.3% |
| Trinidadians and Tobagonians | 0.0 /100 | #332 | Tragic 40.9% |
| Immigrants | Ecuador | 0.0 /100 | #333 | Tragic 40.5% |
| Immigrants | Trinidad and Tobago | 0.0 /100 | #334 | Tragic 40.3% |