Immigrants from Eastern Asia vs Czechoslovakian 4 or more Vehicles in Household
COMPARE
Immigrants from Eastern Asia
Czechoslovakian
4 or more Vehicles in Household
4 or more Vehicles in Household Comparison
Immigrants from Eastern Asia
Czechoslovakians
6.2%
4 OR MORE VEHICLES IN HOUSEHOLD
33.3/ 100
METRIC RATING
189th/ 347
METRIC RANK
7.1%
4 OR MORE VEHICLES IN HOUSEHOLD
99.3/ 100
METRIC RATING
95th/ 347
METRIC RANK
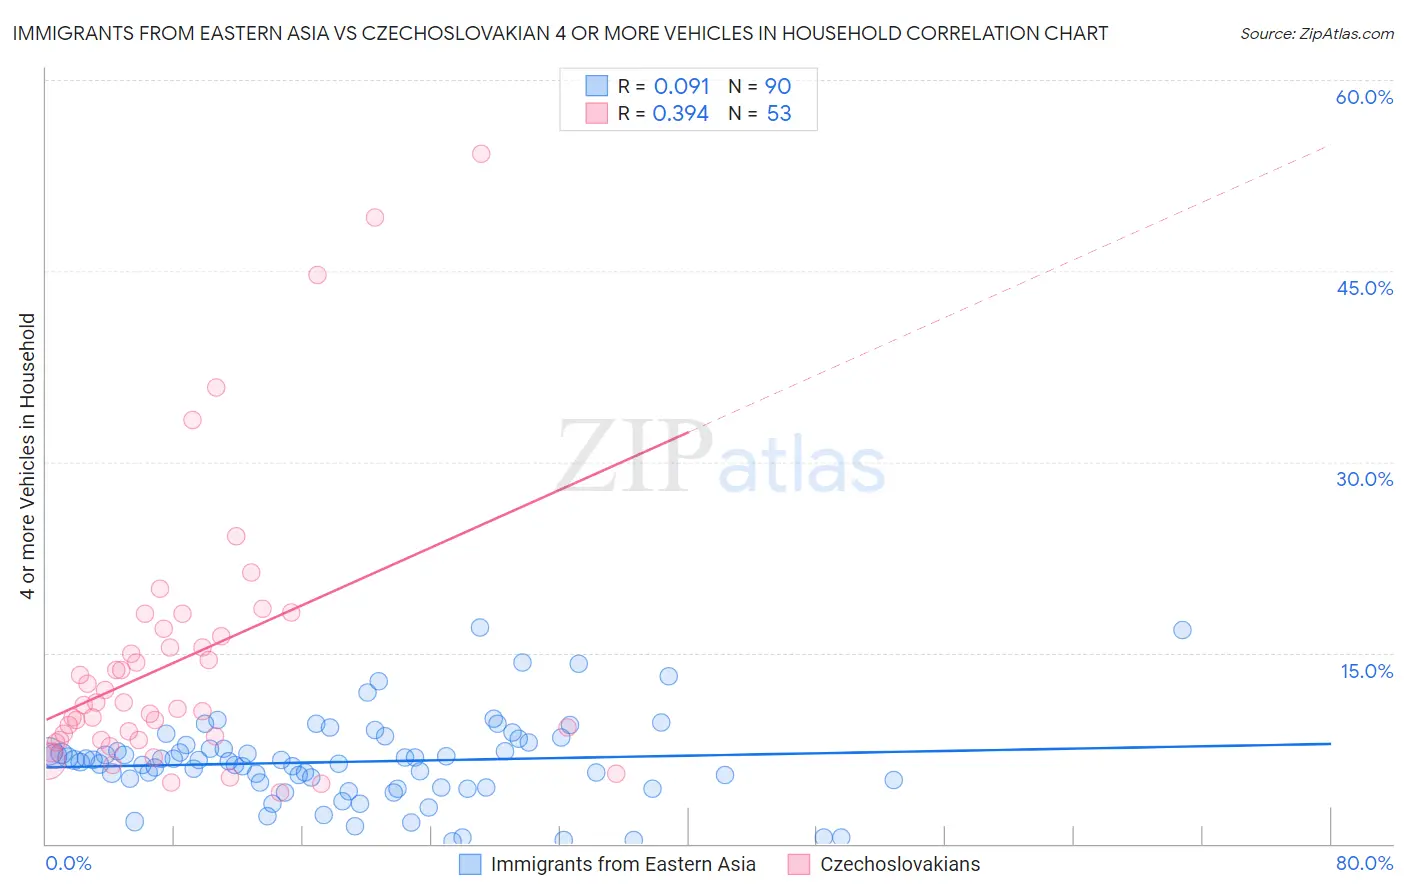
Immigrants from Eastern Asia vs Czechoslovakian 4 or more Vehicles in Household Correlation Chart
The statistical analysis conducted on geographies consisting of 497,144,085 people shows a slight positive correlation between the proportion of Immigrants from Eastern Asia and percentage of households with 4 or more vehicles available in the United States with a correlation coefficient (R) of 0.091 and weighted average of 6.2%. Similarly, the statistical analysis conducted on geographies consisting of 367,717,955 people shows a mild positive correlation between the proportion of Czechoslovakians and percentage of households with 4 or more vehicles available in the United States with a correlation coefficient (R) of 0.394 and weighted average of 7.1%, a difference of 14.5%.
4 or more Vehicles in Household Correlation Summary
| Measurement | Immigrants from Eastern Asia | Czechoslovakian |
| Minimum | 0.22% | 4.1% |
| Maximum | 17.0% | 54.2% |
| Range | 16.8% | 50.1% |
| Mean | 6.4% | 14.5% |
| Median | 6.5% | 10.9% |
| Interquartile 25% (IQ1) | 4.5% | 8.2% |
| Interquartile 75% (IQ3) | 7.8% | 16.6% |
| Interquartile Range (IQR) | 3.3% | 8.4% |
| Standard Deviation (Sample) | 3.3% | 10.7% |
| Standard Deviation (Population) | 3.3% | 10.6% |
Similar Demographics by 4 or more Vehicles in Household
Demographics Similar to Immigrants from Eastern Asia by 4 or more Vehicles in Household
In terms of 4 or more vehicles in household, the demographic groups most similar to Immigrants from Eastern Asia are South African (6.2%, a difference of 0.12%), Kiowa (6.2%, a difference of 0.17%), Immigrants from South Africa (6.2%, a difference of 0.24%), Inupiat (6.2%, a difference of 0.30%), and Romanian (6.2%, a difference of 0.31%).
| Demographics | Rating | Rank | 4 or more Vehicles in Household |
| South American Indians | 40.7 /100 | #182 | Average 6.3% |
| Immigrants | Burma/Myanmar | 37.5 /100 | #183 | Fair 6.2% |
| Iraqis | 37.3 /100 | #184 | Fair 6.2% |
| Thais | 36.9 /100 | #185 | Fair 6.2% |
| Immigrants | Northern Europe | 36.8 /100 | #186 | Fair 6.2% |
| Immigrants | South Africa | 35.4 /100 | #187 | Fair 6.2% |
| Kiowa | 34.7 /100 | #188 | Fair 6.2% |
| Immigrants | Eastern Asia | 33.3 /100 | #189 | Fair 6.2% |
| South Africans | 32.2 /100 | #190 | Fair 6.2% |
| Inupiat | 30.7 /100 | #191 | Fair 6.2% |
| Romanians | 30.7 /100 | #192 | Fair 6.2% |
| Immigrants | Kuwait | 28.0 /100 | #193 | Fair 6.2% |
| Immigrants | Sweden | 27.0 /100 | #194 | Fair 6.2% |
| Argentineans | 27.0 /100 | #195 | Fair 6.2% |
| Tsimshian | 26.4 /100 | #196 | Fair 6.2% |
Demographics Similar to Czechoslovakians by 4 or more Vehicles in Household
In terms of 4 or more vehicles in household, the demographic groups most similar to Czechoslovakians are Central American (7.1%, a difference of 0.010%), Dutch West Indian (7.1%, a difference of 0.21%), Immigrants from Afghanistan (7.1%, a difference of 0.22%), Celtic (7.1%, a difference of 0.37%), and Immigrants from Latin America (7.1%, a difference of 0.39%).
| Demographics | Rating | Rank | 4 or more Vehicles in Household |
| Immigrants | Nonimmigrants | 99.6 /100 | #88 | Exceptional 7.2% |
| British | 99.6 /100 | #89 | Exceptional 7.2% |
| Creek | 99.6 /100 | #90 | Exceptional 7.2% |
| Assyrians/Chaldeans/Syriacs | 99.4 /100 | #91 | Exceptional 7.2% |
| Immigrants | Latin America | 99.4 /100 | #92 | Exceptional 7.1% |
| Immigrants | Afghanistan | 99.3 /100 | #93 | Exceptional 7.1% |
| Dutch West Indians | 99.3 /100 | #94 | Exceptional 7.1% |
| Czechoslovakians | 99.3 /100 | #95 | Exceptional 7.1% |
| Central Americans | 99.3 /100 | #96 | Exceptional 7.1% |
| Celtics | 99.1 /100 | #97 | Exceptional 7.1% |
| Irish | 99.0 /100 | #98 | Exceptional 7.1% |
| Seminole | 98.8 /100 | #99 | Exceptional 7.0% |
| Taiwanese | 98.7 /100 | #100 | Exceptional 7.0% |
| Pakistanis | 98.7 /100 | #101 | Exceptional 7.0% |
| Asians | 98.6 /100 | #102 | Exceptional 7.0% |