African vs Czechoslovakian 4 or more Vehicles in Household
COMPARE
African
Czechoslovakian
4 or more Vehicles in Household
4 or more Vehicles in Household Comparison
Africans
Czechoslovakians
5.8%
4 OR MORE VEHICLES IN HOUSEHOLD
4.6/ 100
METRIC RATING
234th/ 347
METRIC RANK
7.1%
4 OR MORE VEHICLES IN HOUSEHOLD
99.3/ 100
METRIC RATING
95th/ 347
METRIC RANK
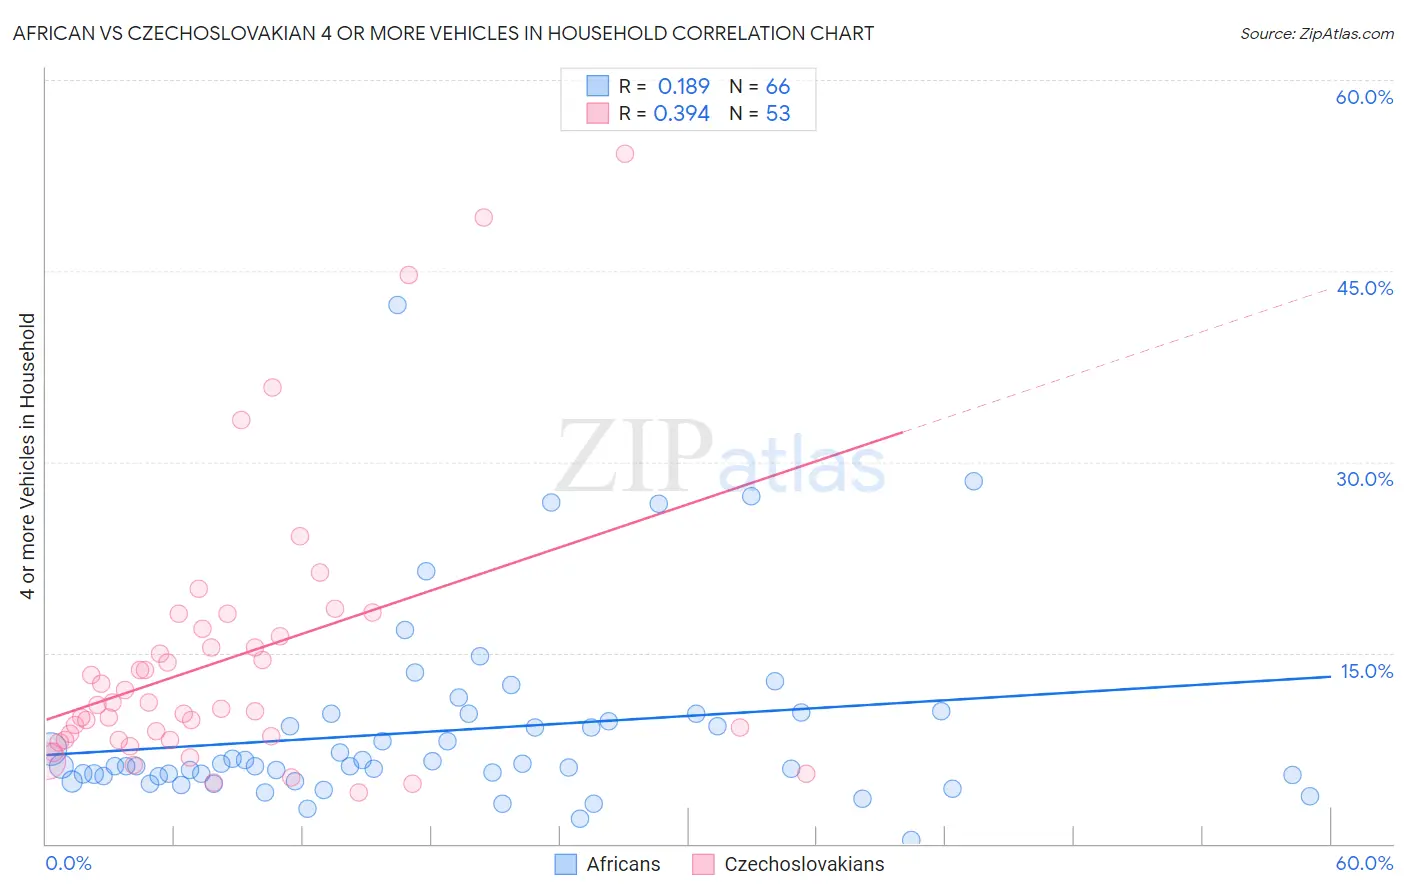
African vs Czechoslovakian 4 or more Vehicles in Household Correlation Chart
The statistical analysis conducted on geographies consisting of 467,634,971 people shows a poor positive correlation between the proportion of Africans and percentage of households with 4 or more vehicles available in the United States with a correlation coefficient (R) of 0.189 and weighted average of 5.8%. Similarly, the statistical analysis conducted on geographies consisting of 367,717,955 people shows a mild positive correlation between the proportion of Czechoslovakians and percentage of households with 4 or more vehicles available in the United States with a correlation coefficient (R) of 0.394 and weighted average of 7.1%, a difference of 21.8%.
4 or more Vehicles in Household Correlation Summary
| Measurement | African | Czechoslovakian |
| Minimum | 0.25% | 4.1% |
| Maximum | 42.3% | 54.2% |
| Range | 42.1% | 50.1% |
| Mean | 8.9% | 14.5% |
| Median | 6.1% | 10.9% |
| Interquartile 25% (IQ1) | 5.4% | 8.2% |
| Interquartile 75% (IQ3) | 10.2% | 16.6% |
| Interquartile Range (IQR) | 4.8% | 8.4% |
| Standard Deviation (Sample) | 7.3% | 10.7% |
| Standard Deviation (Population) | 7.2% | 10.6% |
Similar Demographics by 4 or more Vehicles in Household
Demographics Similar to Africans by 4 or more Vehicles in Household
In terms of 4 or more vehicles in household, the demographic groups most similar to Africans are Immigrants from Hungary (5.8%, a difference of 0.020%), Immigrants from Eritrea (5.8%, a difference of 0.030%), Turkish (5.8%, a difference of 0.31%), Immigrants from Belgium (5.8%, a difference of 0.44%), and Immigrants from Australia (5.8%, a difference of 0.53%).
| Demographics | Rating | Rank | 4 or more Vehicles in Household |
| Immigrants | Western Asia | 7.8 /100 | #227 | Tragic 5.9% |
| Immigrants | Uganda | 7.5 /100 | #228 | Tragic 5.9% |
| Eastern Europeans | 6.8 /100 | #229 | Tragic 5.9% |
| Immigrants | Malaysia | 6.7 /100 | #230 | Tragic 5.9% |
| Immigrants | Switzerland | 6.4 /100 | #231 | Tragic 5.9% |
| Immigrants | Argentina | 6.0 /100 | #232 | Tragic 5.9% |
| Sierra Leoneans | 6.0 /100 | #233 | Tragic 5.9% |
| Africans | 4.6 /100 | #234 | Tragic 5.8% |
| Immigrants | Hungary | 4.6 /100 | #235 | Tragic 5.8% |
| Immigrants | Eritrea | 4.5 /100 | #236 | Tragic 5.8% |
| Turks | 4.1 /100 | #237 | Tragic 5.8% |
| Immigrants | Belgium | 4.0 /100 | #238 | Tragic 5.8% |
| Immigrants | Australia | 3.8 /100 | #239 | Tragic 5.8% |
| Immigrants | Poland | 3.8 /100 | #240 | Tragic 5.8% |
| Mongolians | 3.7 /100 | #241 | Tragic 5.8% |
Demographics Similar to Czechoslovakians by 4 or more Vehicles in Household
In terms of 4 or more vehicles in household, the demographic groups most similar to Czechoslovakians are Central American (7.1%, a difference of 0.010%), Dutch West Indian (7.1%, a difference of 0.21%), Immigrants from Afghanistan (7.1%, a difference of 0.22%), Celtic (7.1%, a difference of 0.37%), and Immigrants from Latin America (7.1%, a difference of 0.39%).
| Demographics | Rating | Rank | 4 or more Vehicles in Household |
| Immigrants | Nonimmigrants | 99.6 /100 | #88 | Exceptional 7.2% |
| British | 99.6 /100 | #89 | Exceptional 7.2% |
| Creek | 99.6 /100 | #90 | Exceptional 7.2% |
| Assyrians/Chaldeans/Syriacs | 99.4 /100 | #91 | Exceptional 7.2% |
| Immigrants | Latin America | 99.4 /100 | #92 | Exceptional 7.1% |
| Immigrants | Afghanistan | 99.3 /100 | #93 | Exceptional 7.1% |
| Dutch West Indians | 99.3 /100 | #94 | Exceptional 7.1% |
| Czechoslovakians | 99.3 /100 | #95 | Exceptional 7.1% |
| Central Americans | 99.3 /100 | #96 | Exceptional 7.1% |
| Celtics | 99.1 /100 | #97 | Exceptional 7.1% |
| Irish | 99.0 /100 | #98 | Exceptional 7.1% |
| Seminole | 98.8 /100 | #99 | Exceptional 7.0% |
| Taiwanese | 98.7 /100 | #100 | Exceptional 7.0% |
| Pakistanis | 98.7 /100 | #101 | Exceptional 7.0% |
| Asians | 98.6 /100 | #102 | Exceptional 7.0% |