French vs Immigrants from Belize 2 or more Vehicles in Household
COMPARE
French
Immigrants from Belize
2 or more Vehicles in Household
2 or more Vehicles in Household Comparison
French
Immigrants from Belize
59.8%
2 OR MORE VEHICLES IN HOUSEHOLD
100.0/ 100
METRIC RATING
44th/ 347
METRIC RANK
49.9%
2 OR MORE VEHICLES IN HOUSEHOLD
0.0/ 100
METRIC RATING
304th/ 347
METRIC RANK
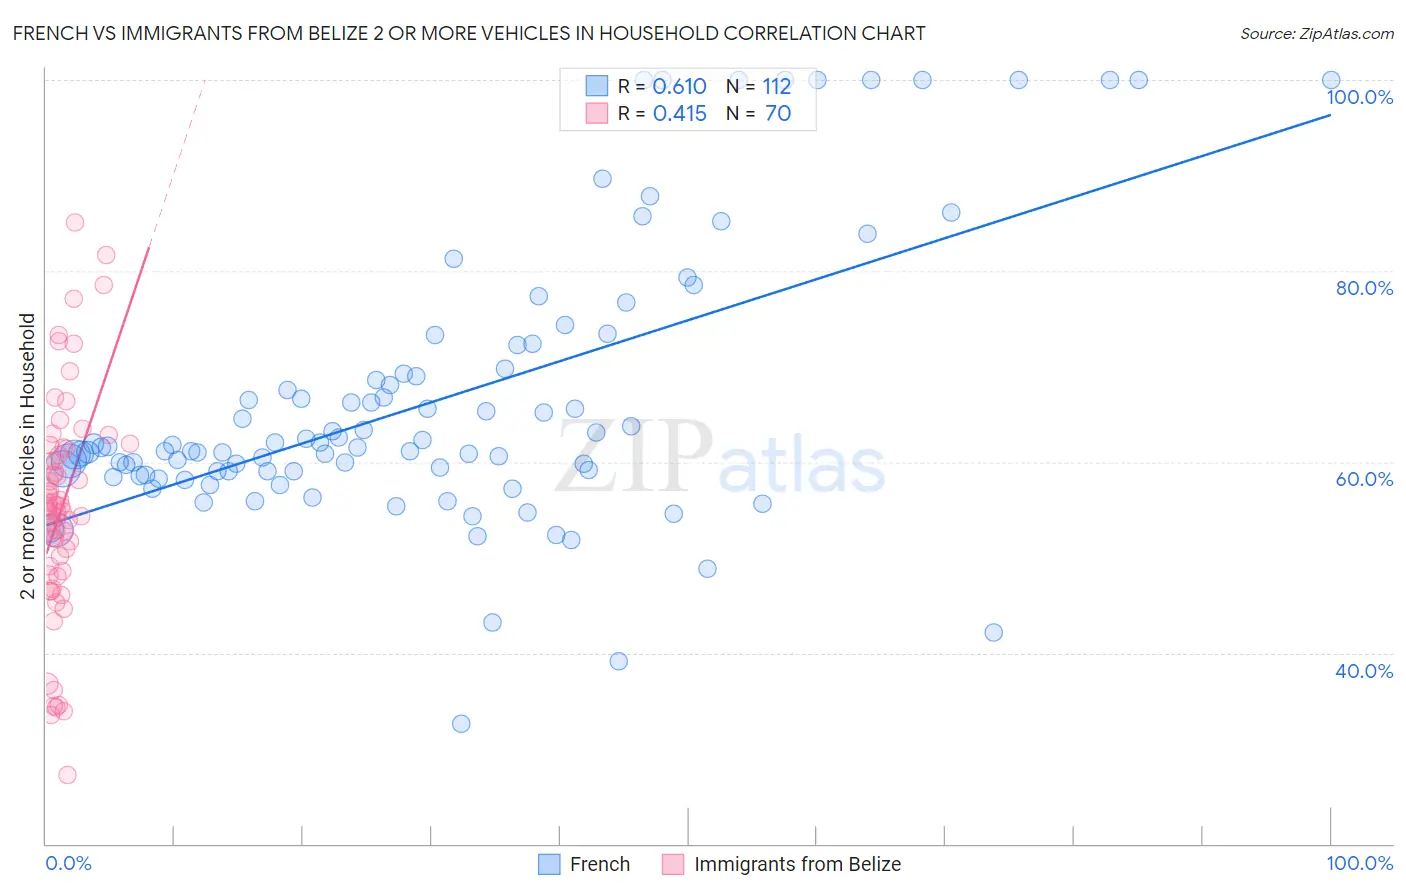
French vs Immigrants from Belize 2 or more Vehicles in Household Correlation Chart
The statistical analysis conducted on geographies consisting of 571,870,956 people shows a significant positive correlation between the proportion of French and percentage of households with 2 or more vehicles available in the United States with a correlation coefficient (R) of 0.610 and weighted average of 59.8%. Similarly, the statistical analysis conducted on geographies consisting of 130,296,303 people shows a moderate positive correlation between the proportion of Immigrants from Belize and percentage of households with 2 or more vehicles available in the United States with a correlation coefficient (R) of 0.415 and weighted average of 49.9%, a difference of 19.8%.
2 or more Vehicles in Household Correlation Summary
| Measurement | French | Immigrants from Belize |
| Minimum | 32.5% | 27.2% |
| Maximum | 100.0% | 85.1% |
| Range | 67.5% | 57.9% |
| Mean | 66.4% | 55.1% |
| Median | 61.5% | 55.1% |
| Interquartile 25% (IQ1) | 58.8% | 48.6% |
| Interquartile 75% (IQ3) | 69.5% | 61.4% |
| Interquartile Range (IQR) | 10.7% | 12.9% |
| Standard Deviation (Sample) | 14.5% | 11.6% |
| Standard Deviation (Population) | 14.4% | 11.5% |
Similar Demographics by 2 or more Vehicles in Household
Demographics Similar to French by 2 or more Vehicles in Household
In terms of 2 or more vehicles in household, the demographic groups most similar to French are Immigrants from Taiwan (59.7%, a difference of 0.040%), Czechoslovakian (59.8%, a difference of 0.060%), Malaysian (59.8%, a difference of 0.14%), Northern European (59.9%, a difference of 0.15%), and Cherokee (59.9%, a difference of 0.17%).
| Demographics | Rating | Rank | 2 or more Vehicles in Household |
| Irish | 100.0 /100 | #37 | Exceptional 60.1% |
| Americans | 100.0 /100 | #38 | Exceptional 60.0% |
| British | 100.0 /100 | #39 | Exceptional 60.0% |
| Cherokee | 100.0 /100 | #40 | Exceptional 59.9% |
| Northern Europeans | 100.0 /100 | #41 | Exceptional 59.9% |
| Malaysians | 100.0 /100 | #42 | Exceptional 59.8% |
| Czechoslovakians | 100.0 /100 | #43 | Exceptional 59.8% |
| French | 100.0 /100 | #44 | Exceptional 59.8% |
| Immigrants | Taiwan | 100.0 /100 | #45 | Exceptional 59.7% |
| Immigrants | South Eastern Asia | 100.0 /100 | #46 | Exceptional 59.6% |
| Yaqui | 99.9 /100 | #47 | Exceptional 59.3% |
| Immigrants | India | 99.9 /100 | #48 | Exceptional 59.3% |
| Belgians | 99.9 /100 | #49 | Exceptional 59.3% |
| Choctaw | 99.9 /100 | #50 | Exceptional 59.3% |
| Spaniards | 99.9 /100 | #51 | Exceptional 59.2% |
Demographics Similar to Immigrants from Belize by 2 or more Vehicles in Household
In terms of 2 or more vehicles in household, the demographic groups most similar to Immigrants from Belize are Tohono O'odham (50.0%, a difference of 0.20%), Immigrants from South America (50.2%, a difference of 0.57%), Immigrants from Greece (50.2%, a difference of 0.63%), Immigrants from Russia (50.3%, a difference of 0.81%), and Immigrants from Morocco (50.3%, a difference of 0.85%).
| Demographics | Rating | Rank | 2 or more Vehicles in Household |
| Immigrants | Spain | 0.0 /100 | #297 | Tragic 50.4% |
| Paraguayans | 0.0 /100 | #298 | Tragic 50.3% |
| Immigrants | Morocco | 0.0 /100 | #299 | Tragic 50.3% |
| Immigrants | Russia | 0.0 /100 | #300 | Tragic 50.3% |
| Immigrants | Greece | 0.0 /100 | #301 | Tragic 50.2% |
| Immigrants | South America | 0.0 /100 | #302 | Tragic 50.2% |
| Tohono O'odham | 0.0 /100 | #303 | Tragic 50.0% |
| Immigrants | Belize | 0.0 /100 | #304 | Tragic 49.9% |
| Immigrants | Western Africa | 0.0 /100 | #305 | Tragic 49.4% |
| Immigrants | Israel | 0.0 /100 | #306 | Tragic 49.2% |
| Hopi | 0.0 /100 | #307 | Tragic 49.0% |
| Albanians | 0.0 /100 | #308 | Tragic 49.0% |
| Moroccans | 0.0 /100 | #309 | Tragic 48.8% |
| Ghanaians | 0.0 /100 | #310 | Tragic 48.0% |
| Immigrants | Belarus | 0.0 /100 | #311 | Tragic 47.9% |