Immigrants from Ethiopia vs Immigrants from Belize 5th Grade
COMPARE
Immigrants from Ethiopia
Immigrants from Belize
5th Grade
5th Grade Comparison
Immigrants from Ethiopia
Immigrants from Belize
96.8%
5TH GRADE
0.5/ 100
METRIC RATING
258th/ 347
METRIC RANK
95.7%
5TH GRADE
0.0/ 100
METRIC RATING
321st/ 347
METRIC RANK
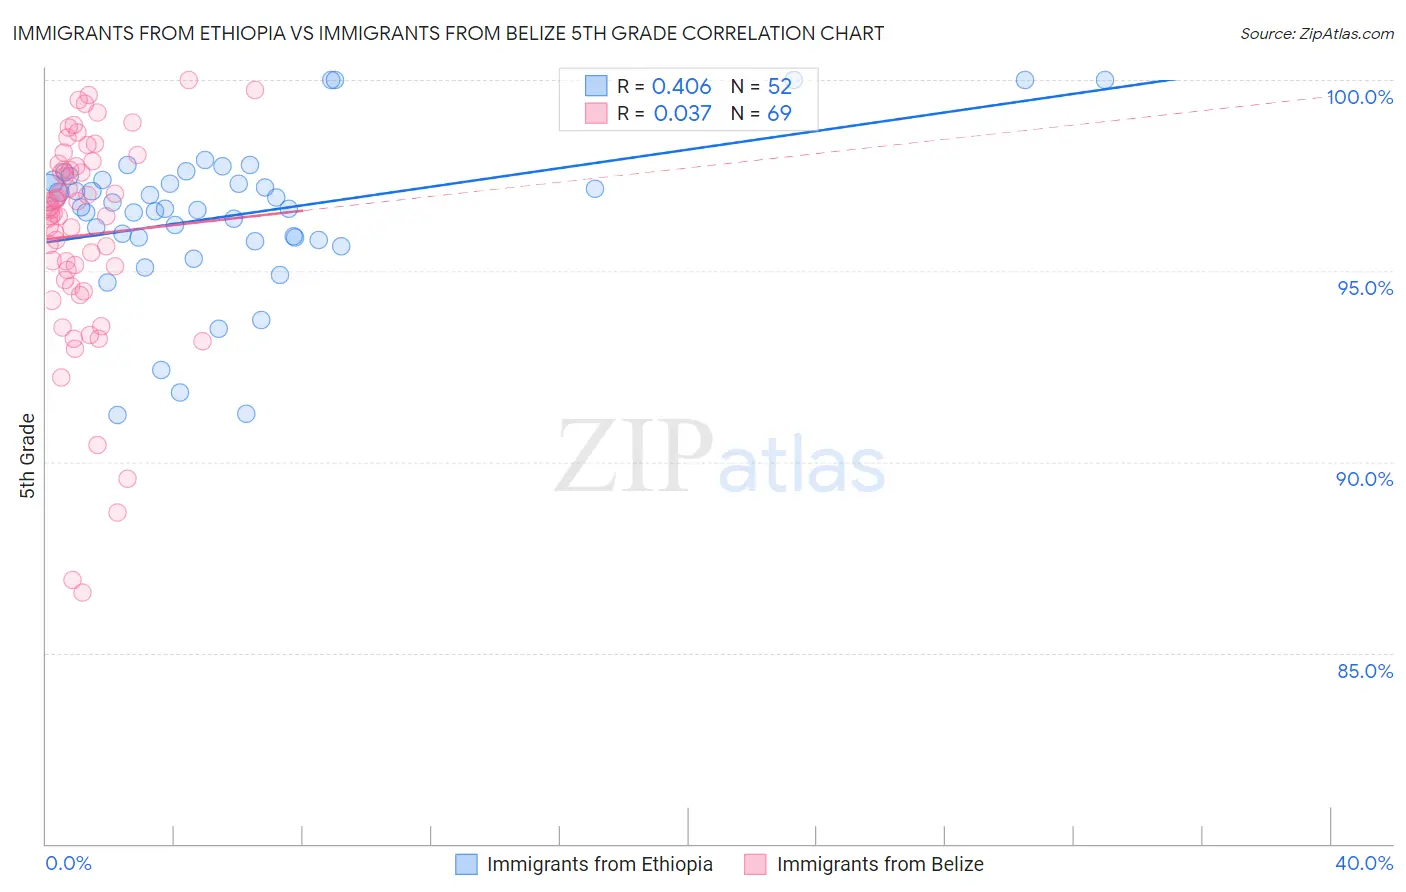
Immigrants from Ethiopia vs Immigrants from Belize 5th Grade Correlation Chart
The statistical analysis conducted on geographies consisting of 211,514,076 people shows a moderate positive correlation between the proportion of Immigrants from Ethiopia and percentage of population with at least 5th grade education in the United States with a correlation coefficient (R) of 0.406 and weighted average of 96.8%. Similarly, the statistical analysis conducted on geographies consisting of 130,328,311 people shows no correlation between the proportion of Immigrants from Belize and percentage of population with at least 5th grade education in the United States with a correlation coefficient (R) of 0.037 and weighted average of 95.7%, a difference of 1.2%.
5th Grade Correlation Summary
| Measurement | Immigrants from Ethiopia | Immigrants from Belize |
| Minimum | 91.2% | 86.6% |
| Maximum | 100.0% | 100.0% |
| Range | 8.8% | 13.4% |
| Mean | 96.5% | 95.9% |
| Median | 96.6% | 96.5% |
| Interquartile 25% (IQ1) | 95.8% | 94.7% |
| Interquartile 75% (IQ3) | 97.4% | 97.8% |
| Interquartile Range (IQR) | 1.5% | 3.1% |
| Standard Deviation (Sample) | 2.0% | 2.8% |
| Standard Deviation (Population) | 2.0% | 2.8% |
Similar Demographics by 5th Grade
Demographics Similar to Immigrants from Ethiopia by 5th Grade
In terms of 5th grade, the demographic groups most similar to Immigrants from Ethiopia are Immigrants from China (96.8%, a difference of 0.0%), Immigrants from Jamaica (96.8%, a difference of 0.020%), Immigrants from Sierra Leone (96.8%, a difference of 0.020%), Immigrants from Congo (96.8%, a difference of 0.030%), and Peruvian (96.8%, a difference of 0.030%).
| Demographics | Rating | Rank | 5th Grade |
| Bolivians | 0.9 /100 | #251 | Tragic 96.9% |
| Jamaicans | 0.9 /100 | #252 | Tragic 96.9% |
| Immigrants | Middle Africa | 0.8 /100 | #253 | Tragic 96.8% |
| Immigrants | Senegal | 0.8 /100 | #254 | Tragic 96.8% |
| South Americans | 0.7 /100 | #255 | Tragic 96.8% |
| Immigrants | Congo | 0.7 /100 | #256 | Tragic 96.8% |
| Peruvians | 0.6 /100 | #257 | Tragic 96.8% |
| Immigrants | Ethiopia | 0.5 /100 | #258 | Tragic 96.8% |
| Immigrants | China | 0.5 /100 | #259 | Tragic 96.8% |
| Immigrants | Jamaica | 0.4 /100 | #260 | Tragic 96.8% |
| Immigrants | Sierra Leone | 0.4 /100 | #261 | Tragic 96.8% |
| Immigrants | Colombia | 0.4 /100 | #262 | Tragic 96.8% |
| Immigrants | Uzbekistan | 0.3 /100 | #263 | Tragic 96.8% |
| West Indians | 0.3 /100 | #264 | Tragic 96.8% |
| Taiwanese | 0.3 /100 | #265 | Tragic 96.7% |
Demographics Similar to Immigrants from Belize by 5th Grade
In terms of 5th grade, the demographic groups most similar to Immigrants from Belize are Immigrants from Nicaragua (95.6%, a difference of 0.020%), Immigrants from Fiji (95.6%, a difference of 0.070%), Japanese (95.7%, a difference of 0.080%), Central American Indian (95.7%, a difference of 0.080%), and Honduran (95.6%, a difference of 0.090%).
| Demographics | Rating | Rank | 5th Grade |
| Immigrants | Portugal | 0.0 /100 | #314 | Tragic 95.9% |
| Nicaraguans | 0.0 /100 | #315 | Tragic 95.9% |
| Immigrants | Ecuador | 0.0 /100 | #316 | Tragic 95.8% |
| Belizeans | 0.0 /100 | #317 | Tragic 95.8% |
| Immigrants | Vietnam | 0.0 /100 | #318 | Tragic 95.8% |
| Japanese | 0.0 /100 | #319 | Tragic 95.7% |
| Central American Indians | 0.0 /100 | #320 | Tragic 95.7% |
| Immigrants | Belize | 0.0 /100 | #321 | Tragic 95.7% |
| Immigrants | Nicaragua | 0.0 /100 | #322 | Tragic 95.6% |
| Immigrants | Fiji | 0.0 /100 | #323 | Tragic 95.6% |
| Hondurans | 0.0 /100 | #324 | Tragic 95.6% |
| Hispanics or Latinos | 0.0 /100 | #325 | Tragic 95.6% |
| Immigrants | Cambodia | 0.0 /100 | #326 | Tragic 95.5% |
| Dominicans | 0.0 /100 | #327 | Tragic 95.5% |
| Cape Verdeans | 0.0 /100 | #328 | Tragic 95.5% |