Immigrants from Ecuador vs Swiss Family Households
COMPARE
Immigrants from Ecuador
Swiss
Family Households
Family Households Comparison
Immigrants from Ecuador
Swiss
64.8%
FAMILY HOUSEHOLDS
91.4/ 100
METRIC RATING
129th/ 347
METRIC RANK
65.2%
FAMILY HOUSEHOLDS
98.6/ 100
METRIC RATING
96th/ 347
METRIC RANK
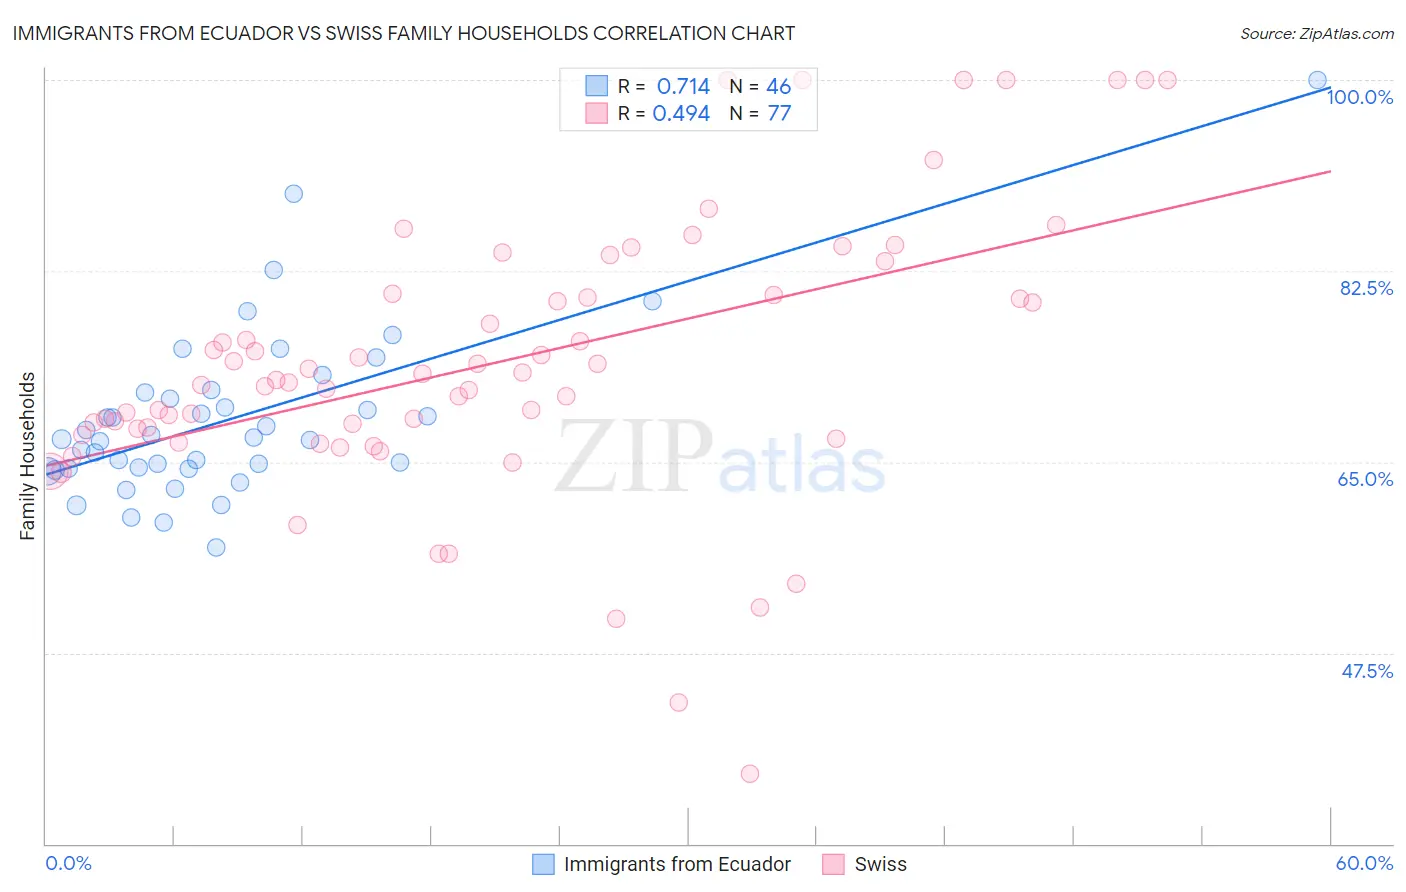
Immigrants from Ecuador vs Swiss Family Households Correlation Chart
The statistical analysis conducted on geographies consisting of 270,888,190 people shows a strong positive correlation between the proportion of Immigrants from Ecuador and percentage of family households in the United States with a correlation coefficient (R) of 0.714 and weighted average of 64.8%. Similarly, the statistical analysis conducted on geographies consisting of 464,763,466 people shows a moderate positive correlation between the proportion of Swiss and percentage of family households in the United States with a correlation coefficient (R) of 0.494 and weighted average of 65.2%, a difference of 0.63%.
Family Households Correlation Summary
| Measurement | Immigrants from Ecuador | Swiss |
| Minimum | 57.2% | 36.4% |
| Maximum | 100.0% | 100.0% |
| Range | 42.8% | 63.6% |
| Mean | 69.0% | 74.1% |
| Median | 67.2% | 72.5% |
| Interquartile 25% (IQ1) | 64.4% | 67.7% |
| Interquartile 75% (IQ3) | 71.4% | 80.3% |
| Interquartile Range (IQR) | 7.0% | 12.6% |
| Standard Deviation (Sample) | 7.8% | 12.7% |
| Standard Deviation (Population) | 7.8% | 12.7% |
Similar Demographics by Family Households
Demographics Similar to Immigrants from Ecuador by Family Households
In terms of family households, the demographic groups most similar to Immigrants from Ecuador are Italian (64.8%, a difference of 0.020%), Immigrants from Panama (64.8%, a difference of 0.030%), Panamanian (64.8%, a difference of 0.050%), Immigrants from Italy (64.8%, a difference of 0.050%), and Nonimmigrants (64.8%, a difference of 0.050%).
| Demographics | Rating | Rank | Family Households |
| Hmong | 93.4 /100 | #122 | Exceptional 64.9% |
| Choctaw | 93.4 /100 | #123 | Exceptional 64.9% |
| Immigrants | Argentina | 92.8 /100 | #124 | Exceptional 64.9% |
| Immigrants | Belize | 92.7 /100 | #125 | Exceptional 64.9% |
| Panamanians | 92.4 /100 | #126 | Exceptional 64.8% |
| Immigrants | Panama | 92.0 /100 | #127 | Exceptional 64.8% |
| Italians | 91.9 /100 | #128 | Exceptional 64.8% |
| Immigrants | Ecuador | 91.4 /100 | #129 | Exceptional 64.8% |
| Immigrants | Italy | 90.2 /100 | #130 | Exceptional 64.8% |
| Immigrants | Nonimmigrants | 90.1 /100 | #131 | Exceptional 64.8% |
| Cajuns | 89.4 /100 | #132 | Excellent 64.8% |
| Belizeans | 89.3 /100 | #133 | Excellent 64.8% |
| Greeks | 88.1 /100 | #134 | Excellent 64.7% |
| Maltese | 87.4 /100 | #135 | Excellent 64.7% |
| Immigrants | China | 86.6 /100 | #136 | Excellent 64.7% |
Demographics Similar to Swiss by Family Households
In terms of family households, the demographic groups most similar to Swiss are Guatemalan (65.2%, a difference of 0.0%), Immigrants from Portugal (65.2%, a difference of 0.010%), Immigrants from Poland (65.2%, a difference of 0.030%), Immigrants from Syria (65.2%, a difference of 0.040%), and Hopi (65.3%, a difference of 0.050%).
| Demographics | Rating | Rank | Family Households |
| Immigrants | Caribbean | 99.1 /100 | #89 | Exceptional 65.3% |
| Immigrants | Laos | 99.1 /100 | #90 | Exceptional 65.3% |
| Crow | 98.9 /100 | #91 | Exceptional 65.3% |
| Hopi | 98.8 /100 | #92 | Exceptional 65.3% |
| Guyanese | 98.8 /100 | #93 | Exceptional 65.3% |
| Immigrants | Poland | 98.7 /100 | #94 | Exceptional 65.2% |
| Immigrants | Portugal | 98.6 /100 | #95 | Exceptional 65.2% |
| Swiss | 98.6 /100 | #96 | Exceptional 65.2% |
| Guatemalans | 98.6 /100 | #97 | Exceptional 65.2% |
| Immigrants | Syria | 98.4 /100 | #98 | Exceptional 65.2% |
| Central American Indians | 98.3 /100 | #99 | Exceptional 65.2% |
| Haitians | 98.1 /100 | #100 | Exceptional 65.2% |
| Chileans | 98.1 /100 | #101 | Exceptional 65.2% |
| Immigrants | Sri Lanka | 98.0 /100 | #102 | Exceptional 65.1% |
| Indians (Asian) | 97.9 /100 | #103 | Exceptional 65.1% |