Immigrants from Eastern Europe vs Alaskan Athabascan 4 or more Vehicles in Household
COMPARE
Immigrants from Eastern Europe
Alaskan Athabascan
4 or more Vehicles in Household
4 or more Vehicles in Household Comparison
Immigrants from Eastern Europe
Alaskan Athabascans
5.4%
4 OR MORE VEHICLES IN HOUSEHOLD
0.4/ 100
METRIC RATING
278th/ 347
METRIC RANK
8.1%
4 OR MORE VEHICLES IN HOUSEHOLD
100.0/ 100
METRIC RATING
34th/ 347
METRIC RANK
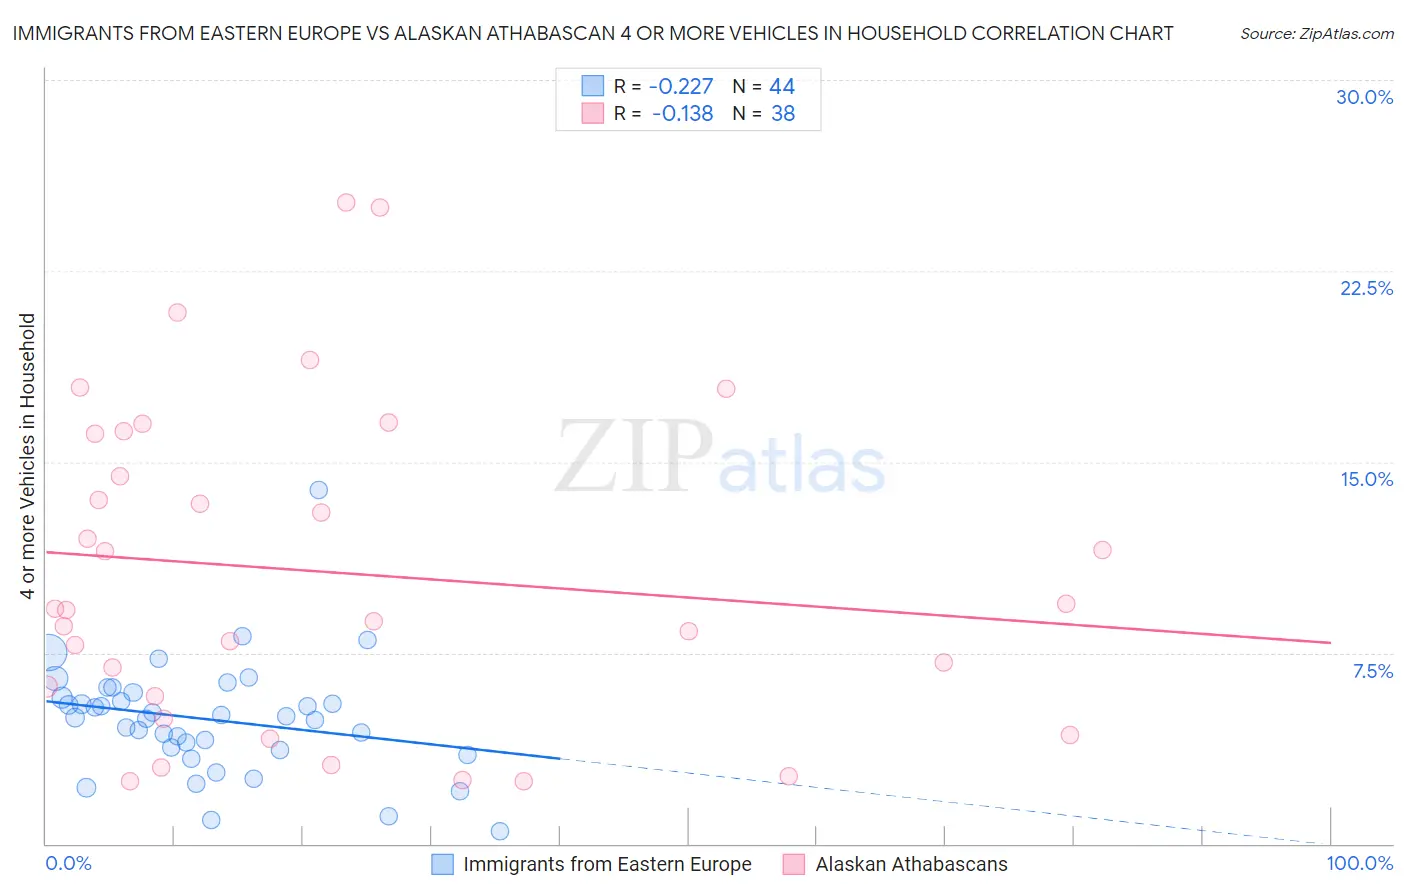
Immigrants from Eastern Europe vs Alaskan Athabascan 4 or more Vehicles in Household Correlation Chart
The statistical analysis conducted on geographies consisting of 473,333,841 people shows a weak negative correlation between the proportion of Immigrants from Eastern Europe and percentage of households with 4 or more vehicles available in the United States with a correlation coefficient (R) of -0.227 and weighted average of 5.4%. Similarly, the statistical analysis conducted on geographies consisting of 45,776,205 people shows a poor negative correlation between the proportion of Alaskan Athabascans and percentage of households with 4 or more vehicles available in the United States with a correlation coefficient (R) of -0.138 and weighted average of 8.1%, a difference of 48.6%.
4 or more Vehicles in Household Correlation Summary
| Measurement | Immigrants from Eastern Europe | Alaskan Athabascan |
| Minimum | 0.50% | 2.4% |
| Maximum | 13.9% | 25.2% |
| Range | 13.4% | 22.8% |
| Mean | 4.9% | 10.7% |
| Median | 5.0% | 9.2% |
| Interquartile 25% (IQ1) | 3.7% | 5.8% |
| Interquartile 75% (IQ3) | 5.8% | 16.1% |
| Interquartile Range (IQR) | 2.1% | 10.3% |
| Standard Deviation (Sample) | 2.3% | 6.3% |
| Standard Deviation (Population) | 2.2% | 6.2% |
Similar Demographics by 4 or more Vehicles in Household
Demographics Similar to Immigrants from Eastern Europe by 4 or more Vehicles in Household
In terms of 4 or more vehicles in household, the demographic groups most similar to Immigrants from Eastern Europe are Immigrants from Uruguay (5.4%, a difference of 0.46%), Alsatian (5.4%, a difference of 0.47%), Immigrants from Western Africa (5.4%, a difference of 0.54%), Immigrants from Spain (5.4%, a difference of 0.71%), and Immigrants from Ireland (5.4%, a difference of 0.79%).
| Demographics | Rating | Rank | 4 or more Vehicles in Household |
| Immigrants | Sudan | 0.6 /100 | #271 | Tragic 5.5% |
| Immigrants | Kazakhstan | 0.6 /100 | #272 | Tragic 5.5% |
| Macedonians | 0.6 /100 | #273 | Tragic 5.5% |
| Blacks/African Americans | 0.6 /100 | #274 | Tragic 5.5% |
| Cambodians | 0.5 /100 | #275 | Tragic 5.5% |
| Immigrants | Latvia | 0.5 /100 | #276 | Tragic 5.5% |
| Immigrants | Bulgaria | 0.5 /100 | #277 | Tragic 5.5% |
| Immigrants | Eastern Europe | 0.4 /100 | #278 | Tragic 5.4% |
| Immigrants | Uruguay | 0.3 /100 | #279 | Tragic 5.4% |
| Alsatians | 0.3 /100 | #280 | Tragic 5.4% |
| Immigrants | Western Africa | 0.3 /100 | #281 | Tragic 5.4% |
| Immigrants | Spain | 0.3 /100 | #282 | Tragic 5.4% |
| Immigrants | Ireland | 0.3 /100 | #283 | Tragic 5.4% |
| Brazilians | 0.3 /100 | #284 | Tragic 5.4% |
| Immigrants | Liberia | 0.2 /100 | #285 | Tragic 5.4% |
Demographics Similar to Alaskan Athabascans by 4 or more Vehicles in Household
In terms of 4 or more vehicles in household, the demographic groups most similar to Alaskan Athabascans are Guamanian/Chamorro (8.1%, a difference of 0.20%), Yaqui (8.1%, a difference of 0.60%), Marshallese (8.1%, a difference of 0.89%), Norwegian (8.0%, a difference of 0.99%), and Scandinavian (8.0%, a difference of 1.2%).
| Demographics | Rating | Rank | 4 or more Vehicles in Household |
| Sri Lankans | 100.0 /100 | #27 | Exceptional 8.4% |
| Cheyenne | 100.0 /100 | #28 | Exceptional 8.3% |
| Immigrants | South Eastern Asia | 100.0 /100 | #29 | Exceptional 8.2% |
| Navajo | 100.0 /100 | #30 | Exceptional 8.2% |
| Natives/Alaskans | 100.0 /100 | #31 | Exceptional 8.2% |
| Marshallese | 100.0 /100 | #32 | Exceptional 8.1% |
| Yaqui | 100.0 /100 | #33 | Exceptional 8.1% |
| Alaskan Athabascans | 100.0 /100 | #34 | Exceptional 8.1% |
| Guamanians/Chamorros | 100.0 /100 | #35 | Exceptional 8.1% |
| Norwegians | 100.0 /100 | #36 | Exceptional 8.0% |
| Scandinavians | 100.0 /100 | #37 | Exceptional 8.0% |
| Sioux | 100.0 /100 | #38 | Exceptional 8.0% |
| Spanish Americans | 100.0 /100 | #39 | Exceptional 8.0% |
| Spanish | 100.0 /100 | #40 | Exceptional 7.9% |
| Pima | 100.0 /100 | #41 | Exceptional 7.9% |