Immigrants from Germany vs Alaskan Athabascan 4 or more Vehicles in Household
COMPARE
Immigrants from Germany
Alaskan Athabascan
4 or more Vehicles in Household
4 or more Vehicles in Household Comparison
Immigrants from Germany
Alaskan Athabascans
6.8%
4 OR MORE VEHICLES IN HOUSEHOLD
94.7/ 100
METRIC RATING
121st/ 347
METRIC RANK
8.1%
4 OR MORE VEHICLES IN HOUSEHOLD
100.0/ 100
METRIC RATING
34th/ 347
METRIC RANK
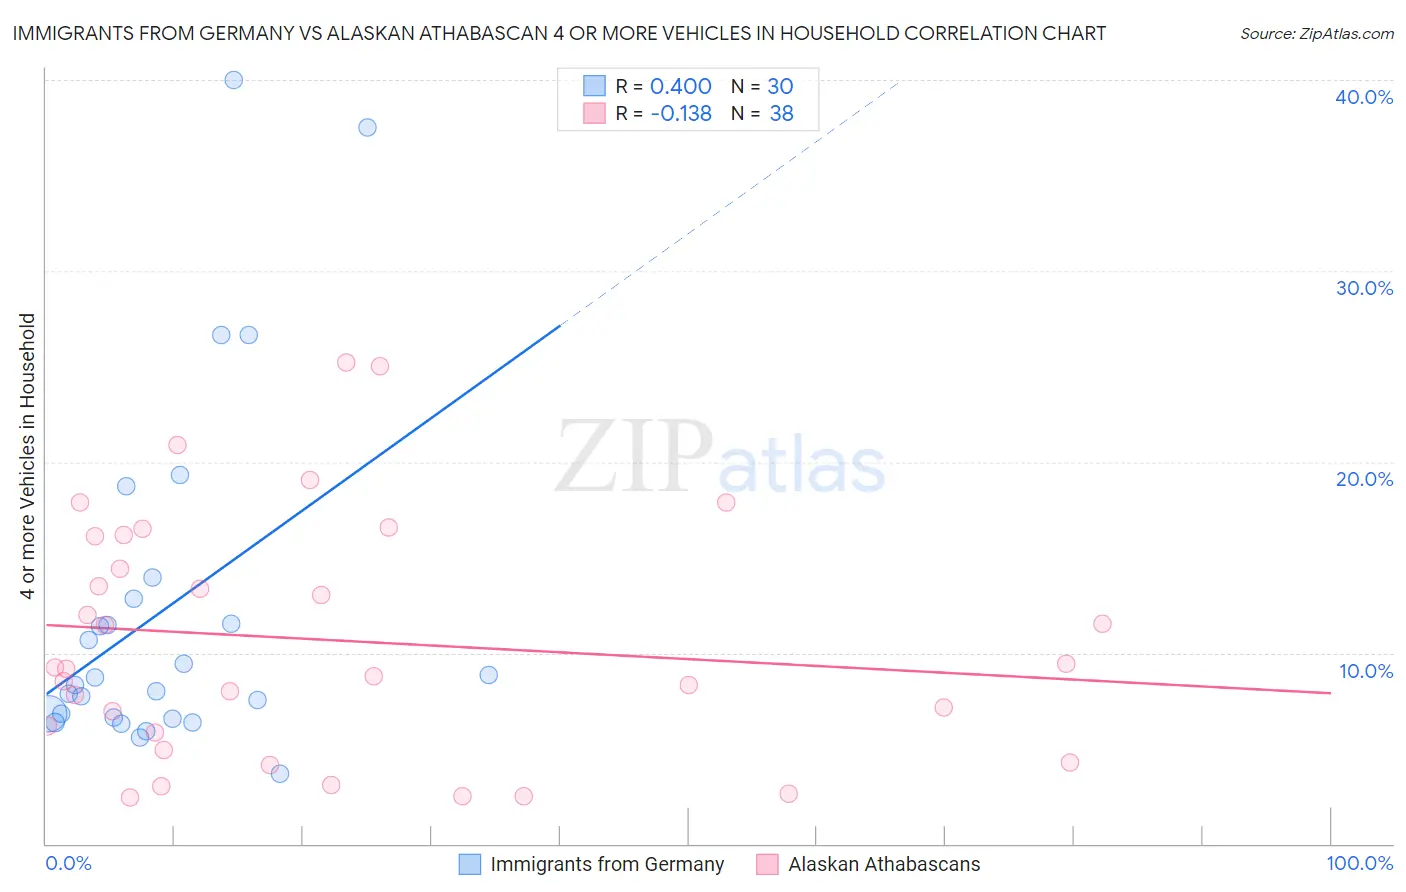
Immigrants from Germany vs Alaskan Athabascan 4 or more Vehicles in Household Correlation Chart
The statistical analysis conducted on geographies consisting of 462,058,551 people shows a mild positive correlation between the proportion of Immigrants from Germany and percentage of households with 4 or more vehicles available in the United States with a correlation coefficient (R) of 0.400 and weighted average of 6.8%. Similarly, the statistical analysis conducted on geographies consisting of 45,776,205 people shows a poor negative correlation between the proportion of Alaskan Athabascans and percentage of households with 4 or more vehicles available in the United States with a correlation coefficient (R) of -0.138 and weighted average of 8.1%, a difference of 19.0%.
4 or more Vehicles in Household Correlation Summary
| Measurement | Immigrants from Germany | Alaskan Athabascan |
| Minimum | 3.7% | 2.4% |
| Maximum | 40.0% | 25.2% |
| Range | 36.3% | 22.8% |
| Mean | 12.3% | 10.7% |
| Median | 8.5% | 9.2% |
| Interquartile 25% (IQ1) | 6.6% | 5.8% |
| Interquartile 75% (IQ3) | 12.8% | 16.1% |
| Interquartile Range (IQR) | 6.2% | 10.3% |
| Standard Deviation (Sample) | 9.2% | 6.3% |
| Standard Deviation (Population) | 9.0% | 6.2% |
Similar Demographics by 4 or more Vehicles in Household
Demographics Similar to Immigrants from Germany by 4 or more Vehicles in Household
In terms of 4 or more vehicles in household, the demographic groups most similar to Immigrants from Germany are Immigrants from Nicaragua (6.8%, a difference of 0.0%), Comanche (6.8%, a difference of 0.060%), Immigrants (6.8%, a difference of 0.070%), Immigrants from Asia (6.8%, a difference of 0.16%), and Austrian (6.8%, a difference of 0.26%).
| Demographics | Rating | Rank | 4 or more Vehicles in Household |
| Bolivians | 96.3 /100 | #114 | Exceptional 6.8% |
| Tlingit-Haida | 96.2 /100 | #115 | Exceptional 6.8% |
| Immigrants | Guatemala | 95.8 /100 | #116 | Exceptional 6.8% |
| Burmese | 95.7 /100 | #117 | Exceptional 6.8% |
| French American Indians | 95.7 /100 | #118 | Exceptional 6.8% |
| Costa Ricans | 95.5 /100 | #119 | Exceptional 6.8% |
| Comanche | 94.8 /100 | #120 | Exceptional 6.8% |
| Immigrants | Germany | 94.7 /100 | #121 | Exceptional 6.8% |
| Immigrants | Nicaragua | 94.7 /100 | #122 | Exceptional 6.8% |
| Immigrants | Immigrants | 94.6 /100 | #123 | Exceptional 6.8% |
| Immigrants | Asia | 94.4 /100 | #124 | Exceptional 6.8% |
| Austrians | 94.1 /100 | #125 | Exceptional 6.8% |
| Belgians | 94.1 /100 | #126 | Exceptional 6.8% |
| Immigrants | Korea | 93.8 /100 | #127 | Exceptional 6.8% |
| Immigrants | Bolivia | 92.5 /100 | #128 | Exceptional 6.7% |
Demographics Similar to Alaskan Athabascans by 4 or more Vehicles in Household
In terms of 4 or more vehicles in household, the demographic groups most similar to Alaskan Athabascans are Guamanian/Chamorro (8.1%, a difference of 0.20%), Yaqui (8.1%, a difference of 0.60%), Marshallese (8.1%, a difference of 0.89%), Norwegian (8.0%, a difference of 0.99%), and Scandinavian (8.0%, a difference of 1.2%).
| Demographics | Rating | Rank | 4 or more Vehicles in Household |
| Sri Lankans | 100.0 /100 | #27 | Exceptional 8.4% |
| Cheyenne | 100.0 /100 | #28 | Exceptional 8.3% |
| Immigrants | South Eastern Asia | 100.0 /100 | #29 | Exceptional 8.2% |
| Navajo | 100.0 /100 | #30 | Exceptional 8.2% |
| Natives/Alaskans | 100.0 /100 | #31 | Exceptional 8.2% |
| Marshallese | 100.0 /100 | #32 | Exceptional 8.1% |
| Yaqui | 100.0 /100 | #33 | Exceptional 8.1% |
| Alaskan Athabascans | 100.0 /100 | #34 | Exceptional 8.1% |
| Guamanians/Chamorros | 100.0 /100 | #35 | Exceptional 8.1% |
| Norwegians | 100.0 /100 | #36 | Exceptional 8.0% |
| Scandinavians | 100.0 /100 | #37 | Exceptional 8.0% |
| Sioux | 100.0 /100 | #38 | Exceptional 8.0% |
| Spanish Americans | 100.0 /100 | #39 | Exceptional 8.0% |
| Spanish | 100.0 /100 | #40 | Exceptional 7.9% |
| Pima | 100.0 /100 | #41 | Exceptional 7.9% |