Yakama vs Zimbabwean 2 or more Vehicles in Household
COMPARE
Yakama
Zimbabwean
2 or more Vehicles in Household
2 or more Vehicles in Household Comparison
Yakama
Zimbabweans
64.9%
2 OR MORE VEHICLES IN HOUSEHOLD
100.0/ 100
METRIC RATING
1st/ 347
METRIC RANK
57.2%
2 OR MORE VEHICLES IN HOUSEHOLD
96.9/ 100
METRIC RATING
113th/ 347
METRIC RANK
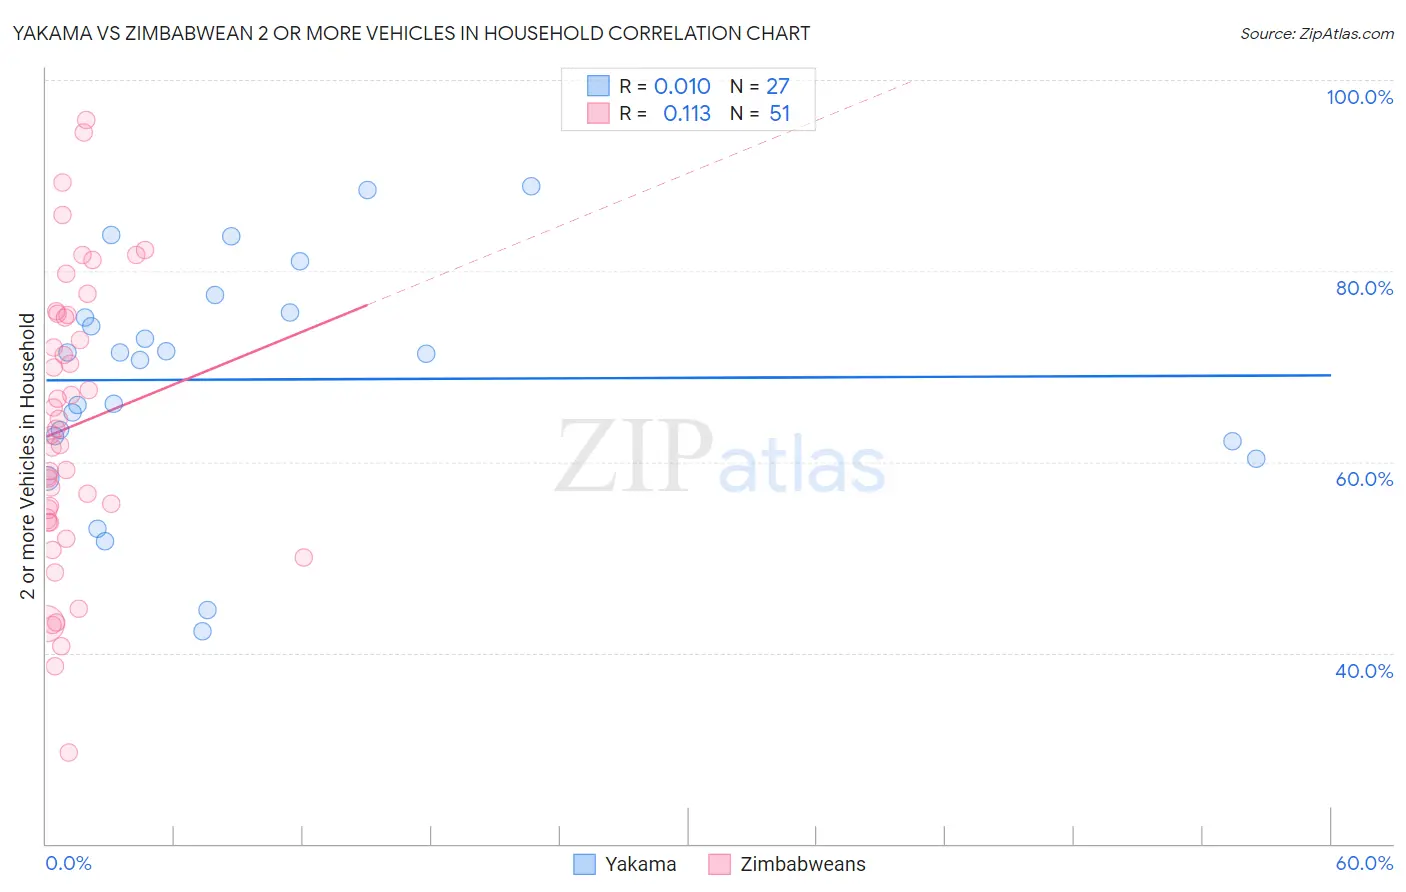
Yakama vs Zimbabwean 2 or more Vehicles in Household Correlation Chart
The statistical analysis conducted on geographies consisting of 19,917,879 people shows no correlation between the proportion of Yakama and percentage of households with 2 or more vehicles available in the United States with a correlation coefficient (R) of 0.010 and weighted average of 64.9%. Similarly, the statistical analysis conducted on geographies consisting of 69,192,017 people shows a poor positive correlation between the proportion of Zimbabweans and percentage of households with 2 or more vehicles available in the United States with a correlation coefficient (R) of 0.113 and weighted average of 57.2%, a difference of 13.4%.
2 or more Vehicles in Household Correlation Summary
| Measurement | Yakama | Zimbabwean |
| Minimum | 42.2% | 29.5% |
| Maximum | 88.9% | 95.8% |
| Range | 46.6% | 66.3% |
| Mean | 68.6% | 63.7% |
| Median | 71.4% | 62.9% |
| Interquartile 25% (IQ1) | 62.1% | 53.7% |
| Interquartile 75% (IQ3) | 75.7% | 75.3% |
| Interquartile Range (IQR) | 13.6% | 21.6% |
| Standard Deviation (Sample) | 12.1% | 14.9% |
| Standard Deviation (Population) | 11.8% | 14.8% |
Similar Demographics by 2 or more Vehicles in Household
Demographics Similar to Yakama by 2 or more Vehicles in Household
In terms of 2 or more vehicles in household, the demographic groups most similar to Yakama are Tongan (63.5%, a difference of 2.2%), Danish (63.3%, a difference of 2.6%), Norwegian (62.8%, a difference of 3.3%), Immigrants from Fiji (62.3%, a difference of 4.2%), and Scandinavian (62.1%, a difference of 4.5%).
| Demographics | Rating | Rank | 2 or more Vehicles in Household |
| Yakama | 100.0 /100 | #1 | Exceptional 64.9% |
| Tongans | 100.0 /100 | #2 | Exceptional 63.5% |
| Danes | 100.0 /100 | #3 | Exceptional 63.3% |
| Norwegians | 100.0 /100 | #4 | Exceptional 62.8% |
| Immigrants | Fiji | 100.0 /100 | #5 | Exceptional 62.3% |
| Scandinavians | 100.0 /100 | #6 | Exceptional 62.1% |
| Puget Sound Salish | 100.0 /100 | #7 | Exceptional 62.1% |
| English | 100.0 /100 | #8 | Exceptional 61.9% |
| Swedes | 100.0 /100 | #9 | Exceptional 61.8% |
| Mexicans | 100.0 /100 | #10 | Exceptional 61.7% |
| Dutch | 100.0 /100 | #11 | Exceptional 61.6% |
| Germans | 100.0 /100 | #12 | Exceptional 61.6% |
| Samoans | 100.0 /100 | #13 | Exceptional 61.5% |
| Czechs | 100.0 /100 | #14 | Exceptional 61.5% |
| Nepalese | 100.0 /100 | #15 | Exceptional 61.4% |
Demographics Similar to Zimbabweans by 2 or more Vehicles in Household
In terms of 2 or more vehicles in household, the demographic groups most similar to Zimbabweans are Immigrants from Lebanon (57.2%, a difference of 0.030%), Chippewa (57.2%, a difference of 0.090%), Immigrants from Jordan (57.2%, a difference of 0.10%), Iraqi (57.1%, a difference of 0.29%), and Greek (57.5%, a difference of 0.42%).
| Demographics | Rating | Rank | 2 or more Vehicles in Household |
| Immigrants | Oceania | 98.2 /100 | #106 | Exceptional 57.5% |
| Immigrants | Netherlands | 98.2 /100 | #107 | Exceptional 57.5% |
| Immigrants | Canada | 98.1 /100 | #108 | Exceptional 57.5% |
| Immigrants | North America | 98.1 /100 | #109 | Exceptional 57.5% |
| Japanese | 98.0 /100 | #110 | Exceptional 57.5% |
| Greeks | 98.0 /100 | #111 | Exceptional 57.5% |
| Pueblo | 98.0 /100 | #112 | Exceptional 57.5% |
| Zimbabweans | 96.9 /100 | #113 | Exceptional 57.2% |
| Immigrants | Lebanon | 96.8 /100 | #114 | Exceptional 57.2% |
| Chippewa | 96.6 /100 | #115 | Exceptional 57.2% |
| Immigrants | Jordan | 96.6 /100 | #116 | Exceptional 57.2% |
| Iraqis | 95.8 /100 | #117 | Exceptional 57.1% |
| Asians | 95.1 /100 | #118 | Exceptional 57.0% |
| Natives/Alaskans | 95.0 /100 | #119 | Exceptional 57.0% |
| Costa Ricans | 94.7 /100 | #120 | Exceptional 56.9% |