Immigrants from Eastern Asia vs Zimbabwean In Labor Force | Age > 16
COMPARE
Immigrants from Eastern Asia
Zimbabwean
In Labor Force | Age > 16
In Labor Force | Age > 16 Comparison
Immigrants from Eastern Asia
Zimbabweans
65.7%
IN LABOR FORCE | AGE > 16
94.9/ 100
METRIC RATING
127th/ 347
METRIC RANK
67.3%
IN LABOR FORCE | AGE > 16
100.0/ 100
METRIC RATING
27th/ 347
METRIC RANK
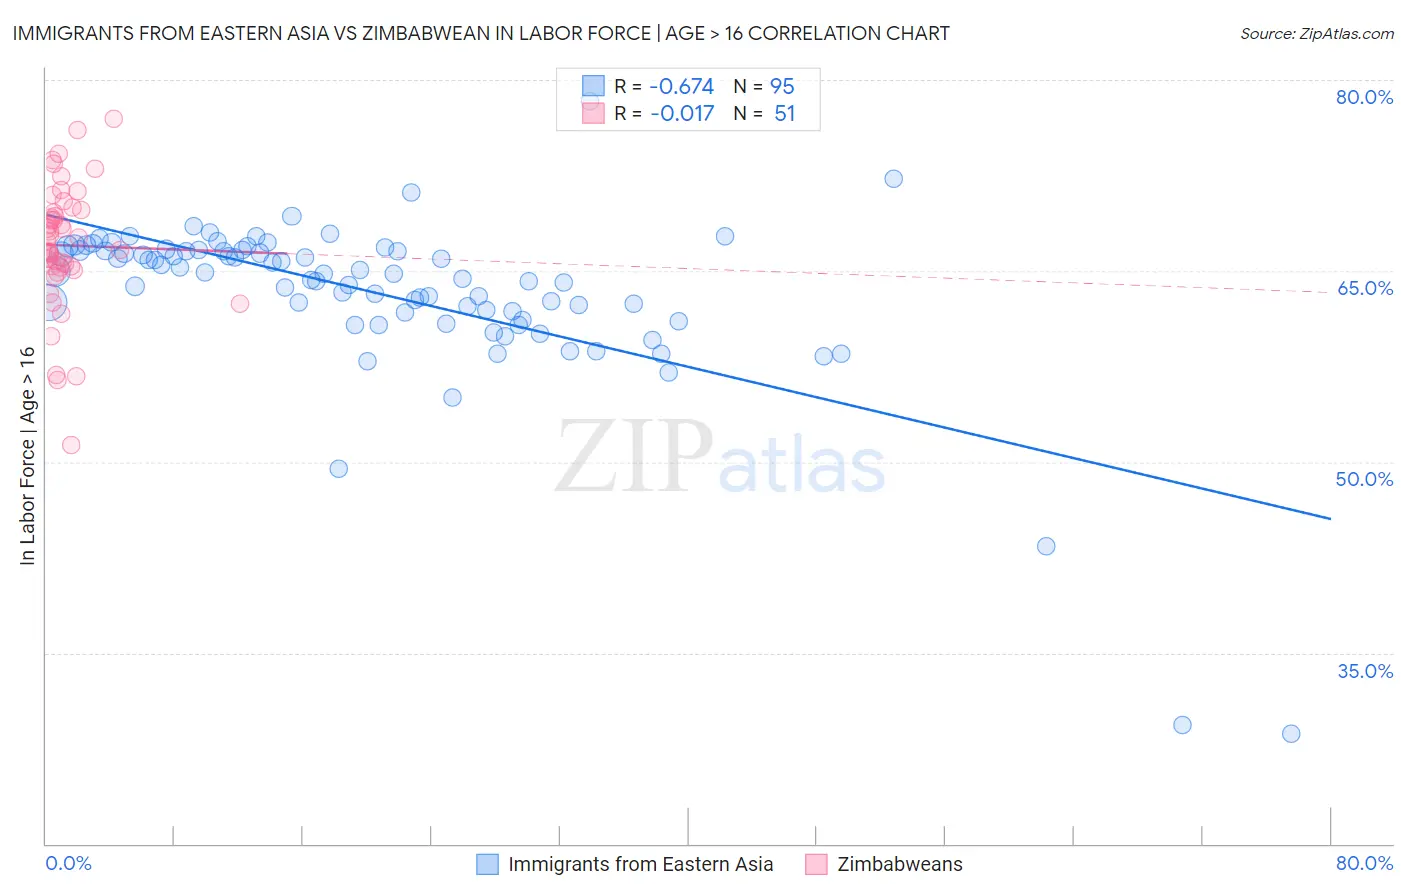
Immigrants from Eastern Asia vs Zimbabwean In Labor Force | Age > 16 Correlation Chart
The statistical analysis conducted on geographies consisting of 499,974,052 people shows a significant negative correlation between the proportion of Immigrants from Eastern Asia and labor force participation rate among population ages 16 and over in the United States with a correlation coefficient (R) of -0.674 and weighted average of 65.7%. Similarly, the statistical analysis conducted on geographies consisting of 69,208,654 people shows no correlation between the proportion of Zimbabweans and labor force participation rate among population ages 16 and over in the United States with a correlation coefficient (R) of -0.017 and weighted average of 67.3%, a difference of 2.5%.
In Labor Force | Age > 16 Correlation Summary
| Measurement | Immigrants from Eastern Asia | Zimbabwean |
| Minimum | 28.6% | 51.3% |
| Maximum | 78.3% | 77.0% |
| Range | 49.7% | 25.7% |
| Mean | 63.3% | 67.0% |
| Median | 64.8% | 67.4% |
| Interquartile 25% (IQ1) | 61.7% | 65.3% |
| Interquartile 75% (IQ3) | 66.6% | 69.8% |
| Interquartile Range (IQR) | 4.9% | 4.5% |
| Standard Deviation (Sample) | 6.7% | 5.0% |
| Standard Deviation (Population) | 6.7% | 4.9% |
Similar Demographics by In Labor Force | Age > 16
Demographics Similar to Immigrants from Eastern Asia by In Labor Force | Age > 16
In terms of in labor force | age > 16, the demographic groups most similar to Immigrants from Eastern Asia are Ecuadorian (65.6%, a difference of 0.010%), Korean (65.7%, a difference of 0.020%), Immigrants from Philippines (65.6%, a difference of 0.020%), Iraqi (65.7%, a difference of 0.030%), and Norwegian (65.7%, a difference of 0.030%).
| Demographics | Rating | Rank | In Labor Force | Age > 16 |
| Immigrants | Hong Kong | 96.2 /100 | #120 | Exceptional 65.7% |
| New Zealanders | 96.0 /100 | #121 | Exceptional 65.7% |
| Immigrants | Ecuador | 95.9 /100 | #122 | Exceptional 65.7% |
| Immigrants | Iraq | 95.5 /100 | #123 | Exceptional 65.7% |
| Iraqis | 95.4 /100 | #124 | Exceptional 65.7% |
| Norwegians | 95.3 /100 | #125 | Exceptional 65.7% |
| Koreans | 95.3 /100 | #126 | Exceptional 65.7% |
| Immigrants | Eastern Asia | 94.9 /100 | #127 | Exceptional 65.7% |
| Ecuadorians | 94.7 /100 | #128 | Exceptional 65.6% |
| Immigrants | Philippines | 94.5 /100 | #129 | Exceptional 65.6% |
| Immigrants | Guatemala | 94.4 /100 | #130 | Exceptional 65.6% |
| Icelanders | 94.3 /100 | #131 | Exceptional 65.6% |
| Immigrants | North Macedonia | 94.1 /100 | #132 | Exceptional 65.6% |
| Immigrants | Lithuania | 93.5 /100 | #133 | Exceptional 65.6% |
| Costa Ricans | 93.2 /100 | #134 | Exceptional 65.6% |
Demographics Similar to Zimbabweans by In Labor Force | Age > 16
In terms of in labor force | age > 16, the demographic groups most similar to Zimbabweans are Immigrants from Cabo Verde (67.3%, a difference of 0.080%), Immigrants from Morocco (67.2%, a difference of 0.080%), Immigrants from Africa (67.4%, a difference of 0.11%), Thai (67.2%, a difference of 0.12%), and Immigrants from Zaire (67.2%, a difference of 0.12%).
| Demographics | Rating | Rank | In Labor Force | Age > 16 |
| Immigrants | Kenya | 100.0 /100 | #20 | Exceptional 67.6% |
| Tongans | 100.0 /100 | #21 | Exceptional 67.5% |
| Immigrants | Uganda | 100.0 /100 | #22 | Exceptional 67.5% |
| Cambodians | 100.0 /100 | #23 | Exceptional 67.4% |
| Ugandans | 100.0 /100 | #24 | Exceptional 67.4% |
| Immigrants | Africa | 100.0 /100 | #25 | Exceptional 67.4% |
| Immigrants | Cabo Verde | 100.0 /100 | #26 | Exceptional 67.3% |
| Zimbabweans | 100.0 /100 | #27 | Exceptional 67.3% |
| Immigrants | Morocco | 100.0 /100 | #28 | Exceptional 67.2% |
| Thais | 100.0 /100 | #29 | Exceptional 67.2% |
| Immigrants | Zaire | 100.0 /100 | #30 | Exceptional 67.2% |
| Ghanaians | 100.0 /100 | #31 | Exceptional 67.1% |
| Immigrants | Congo | 100.0 /100 | #32 | Exceptional 67.1% |
| Afghans | 100.0 /100 | #33 | Exceptional 67.1% |
| Immigrants | Ghana | 100.0 /100 | #34 | Exceptional 67.1% |