Finnish vs Zimbabwean 2 or more Vehicles in Household
COMPARE
Finnish
Zimbabwean
2 or more Vehicles in Household
2 or more Vehicles in Household Comparison
Finns
Zimbabweans
60.3%
2 OR MORE VEHICLES IN HOUSEHOLD
100.0/ 100
METRIC RATING
30th/ 347
METRIC RANK
57.2%
2 OR MORE VEHICLES IN HOUSEHOLD
96.9/ 100
METRIC RATING
113th/ 347
METRIC RANK
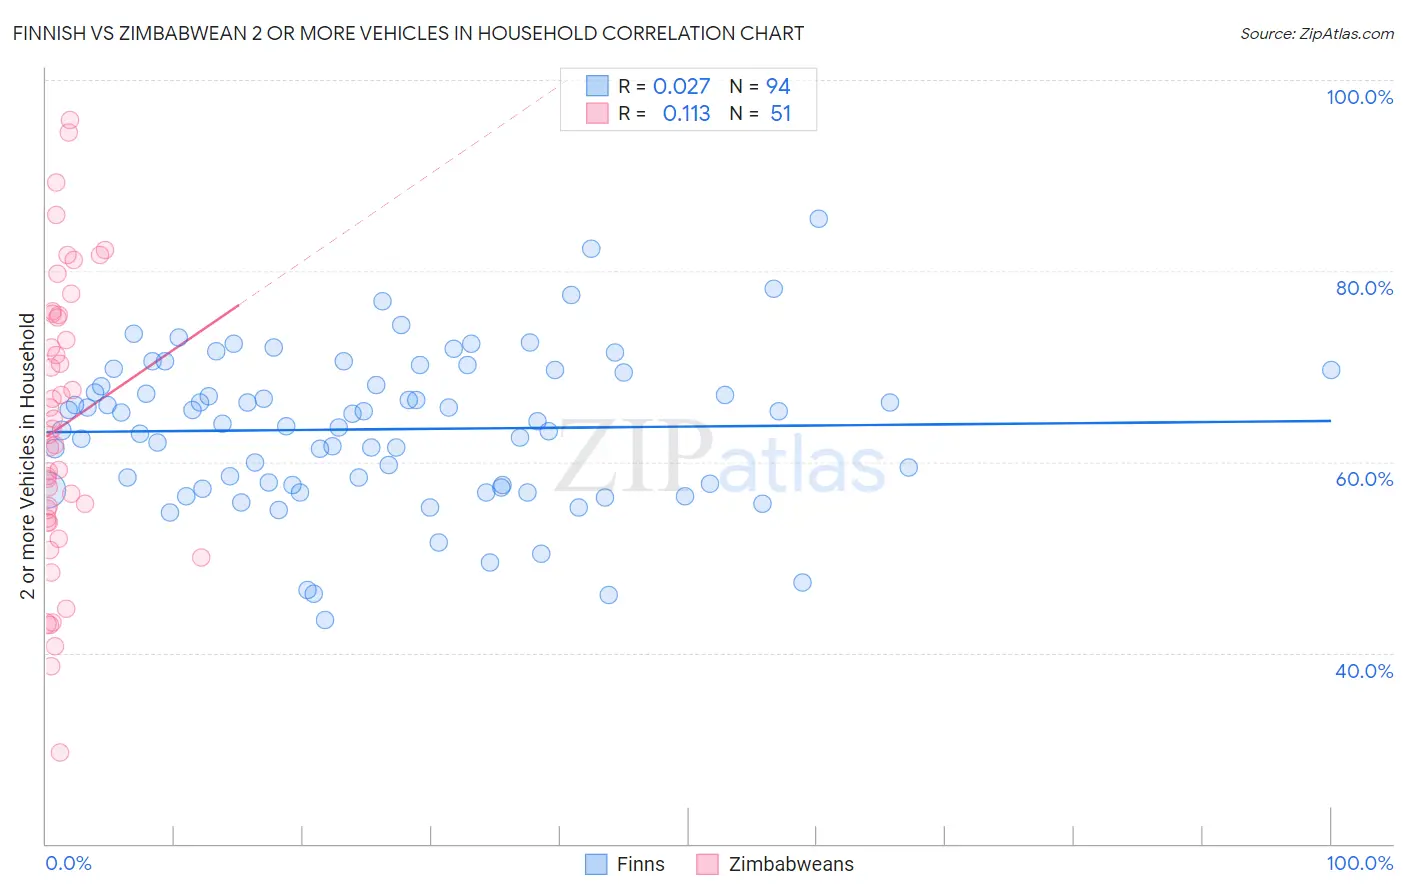
Finnish vs Zimbabwean 2 or more Vehicles in Household Correlation Chart
The statistical analysis conducted on geographies consisting of 404,547,862 people shows no correlation between the proportion of Finns and percentage of households with 2 or more vehicles available in the United States with a correlation coefficient (R) of 0.027 and weighted average of 60.3%. Similarly, the statistical analysis conducted on geographies consisting of 69,192,017 people shows a poor positive correlation between the proportion of Zimbabweans and percentage of households with 2 or more vehicles available in the United States with a correlation coefficient (R) of 0.113 and weighted average of 57.2%, a difference of 5.4%.
2 or more Vehicles in Household Correlation Summary
| Measurement | Finnish | Zimbabwean |
| Minimum | 43.4% | 29.5% |
| Maximum | 85.5% | 95.8% |
| Range | 42.1% | 66.3% |
| Mean | 63.4% | 63.7% |
| Median | 64.1% | 62.9% |
| Interquartile 25% (IQ1) | 57.6% | 53.7% |
| Interquartile 75% (IQ3) | 69.4% | 75.3% |
| Interquartile Range (IQR) | 11.8% | 21.6% |
| Standard Deviation (Sample) | 8.0% | 14.9% |
| Standard Deviation (Population) | 8.0% | 14.8% |
Similar Demographics by 2 or more Vehicles in Household
Demographics Similar to Finns by 2 or more Vehicles in Household
In terms of 2 or more vehicles in household, the demographic groups most similar to Finns are Spanish American Indian (60.3%, a difference of 0.030%), Hawaiian (60.4%, a difference of 0.13%), Arapaho (60.2%, a difference of 0.13%), Immigrants from Mexico (60.2%, a difference of 0.19%), and Guamanian/Chamorro (60.5%, a difference of 0.24%).
| Demographics | Rating | Rank | 2 or more Vehicles in Household |
| Scotch-Irish | 100.0 /100 | #23 | Exceptional 60.9% |
| Immigrants | Vietnam | 100.0 /100 | #24 | Exceptional 60.9% |
| Whites/Caucasians | 100.0 /100 | #25 | Exceptional 60.8% |
| Welsh | 100.0 /100 | #26 | Exceptional 60.8% |
| Assyrians/Chaldeans/Syriacs | 100.0 /100 | #27 | Exceptional 60.5% |
| Guamanians/Chamorros | 100.0 /100 | #28 | Exceptional 60.5% |
| Hawaiians | 100.0 /100 | #29 | Exceptional 60.4% |
| Finns | 100.0 /100 | #30 | Exceptional 60.3% |
| Spanish American Indians | 100.0 /100 | #31 | Exceptional 60.3% |
| Arapaho | 100.0 /100 | #32 | Exceptional 60.2% |
| Immigrants | Mexico | 100.0 /100 | #33 | Exceptional 60.2% |
| Spanish | 100.0 /100 | #34 | Exceptional 60.2% |
| Immigrants | Philippines | 100.0 /100 | #35 | Exceptional 60.1% |
| Chinese | 100.0 /100 | #36 | Exceptional 60.1% |
| Irish | 100.0 /100 | #37 | Exceptional 60.1% |
Demographics Similar to Zimbabweans by 2 or more Vehicles in Household
In terms of 2 or more vehicles in household, the demographic groups most similar to Zimbabweans are Immigrants from Lebanon (57.2%, a difference of 0.030%), Chippewa (57.2%, a difference of 0.090%), Immigrants from Jordan (57.2%, a difference of 0.10%), Iraqi (57.1%, a difference of 0.29%), and Greek (57.5%, a difference of 0.42%).
| Demographics | Rating | Rank | 2 or more Vehicles in Household |
| Immigrants | Oceania | 98.2 /100 | #106 | Exceptional 57.5% |
| Immigrants | Netherlands | 98.2 /100 | #107 | Exceptional 57.5% |
| Immigrants | Canada | 98.1 /100 | #108 | Exceptional 57.5% |
| Immigrants | North America | 98.1 /100 | #109 | Exceptional 57.5% |
| Japanese | 98.0 /100 | #110 | Exceptional 57.5% |
| Greeks | 98.0 /100 | #111 | Exceptional 57.5% |
| Pueblo | 98.0 /100 | #112 | Exceptional 57.5% |
| Zimbabweans | 96.9 /100 | #113 | Exceptional 57.2% |
| Immigrants | Lebanon | 96.8 /100 | #114 | Exceptional 57.2% |
| Chippewa | 96.6 /100 | #115 | Exceptional 57.2% |
| Immigrants | Jordan | 96.6 /100 | #116 | Exceptional 57.2% |
| Iraqis | 95.8 /100 | #117 | Exceptional 57.1% |
| Asians | 95.1 /100 | #118 | Exceptional 57.0% |
| Natives/Alaskans | 95.0 /100 | #119 | Exceptional 57.0% |
| Costa Ricans | 94.7 /100 | #120 | Exceptional 56.9% |