Immigrants from Middle Africa vs Immigrants from Caribbean 2 or more Vehicles in Household
COMPARE
Immigrants from Middle Africa
Immigrants from Caribbean
2 or more Vehicles in Household
2 or more Vehicles in Household Comparison
Immigrants from Middle Africa
Immigrants from Caribbean
53.4%
2 OR MORE VEHICLES IN HOUSEHOLD
3.0/ 100
METRIC RATING
235th/ 347
METRIC RANK
44.2%
2 OR MORE VEHICLES IN HOUSEHOLD
0.0/ 100
METRIC RATING
323rd/ 347
METRIC RANK
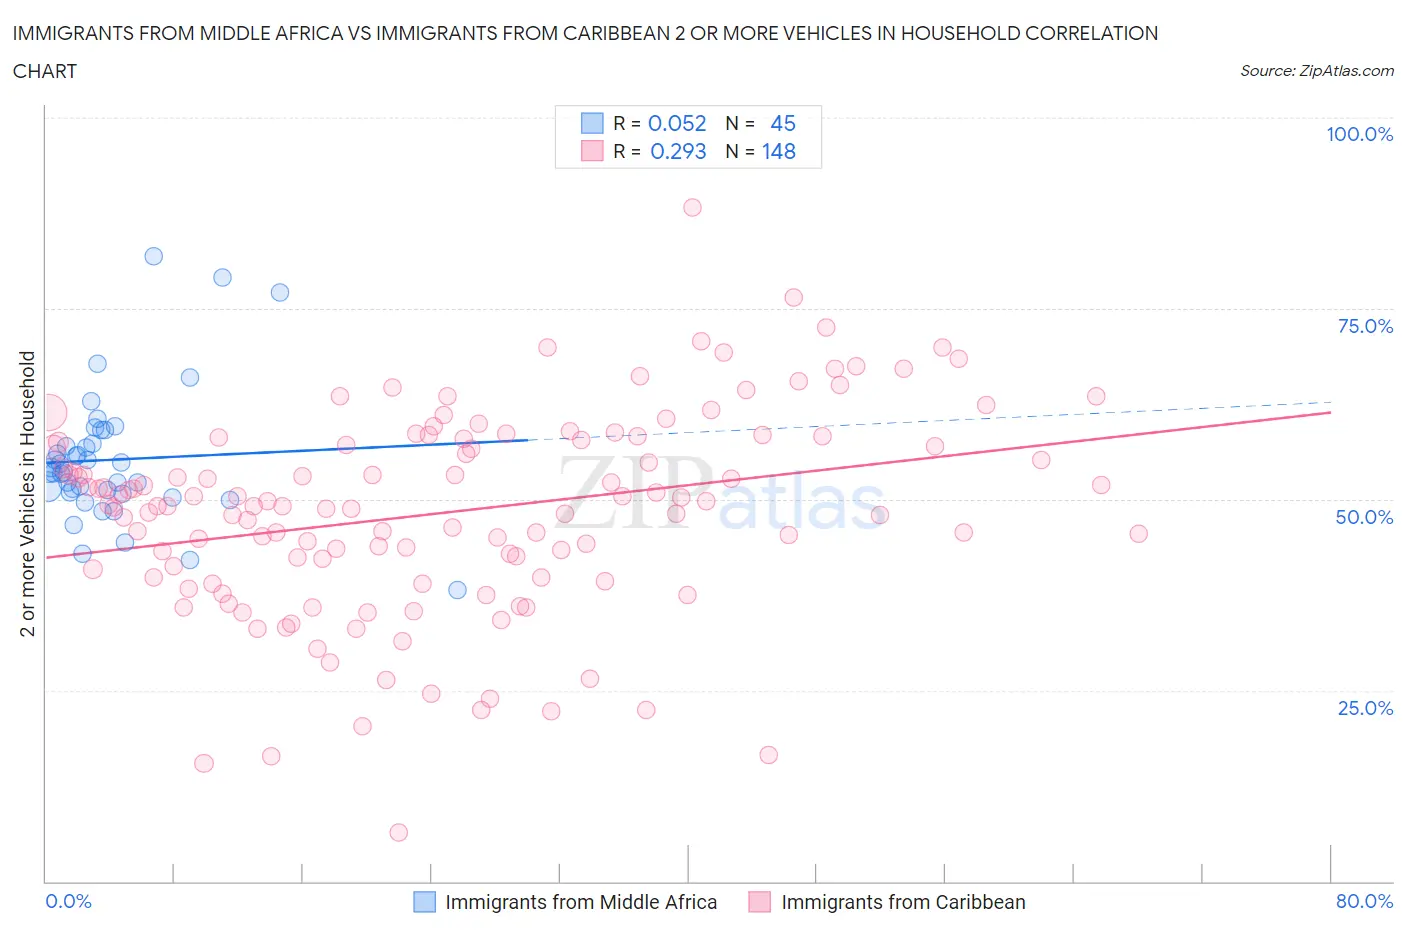
Immigrants from Middle Africa vs Immigrants from Caribbean 2 or more Vehicles in Household Correlation Chart
The statistical analysis conducted on geographies consisting of 202,671,217 people shows a slight positive correlation between the proportion of Immigrants from Middle Africa and percentage of households with 2 or more vehicles available in the United States with a correlation coefficient (R) of 0.052 and weighted average of 53.4%. Similarly, the statistical analysis conducted on geographies consisting of 449,714,597 people shows a weak positive correlation between the proportion of Immigrants from Caribbean and percentage of households with 2 or more vehicles available in the United States with a correlation coefficient (R) of 0.293 and weighted average of 44.2%, a difference of 20.8%.
2 or more Vehicles in Household Correlation Summary
| Measurement | Immigrants from Middle Africa | Immigrants from Caribbean |
| Minimum | 38.1% | 6.4% |
| Maximum | 81.8% | 88.2% |
| Range | 43.7% | 81.8% |
| Mean | 55.2% | 48.3% |
| Median | 53.5% | 49.1% |
| Interquartile 25% (IQ1) | 50.8% | 40.3% |
| Interquartile 75% (IQ3) | 58.1% | 57.6% |
| Interquartile Range (IQR) | 7.4% | 17.3% |
| Standard Deviation (Sample) | 8.7% | 13.3% |
| Standard Deviation (Population) | 8.6% | 13.3% |
Similar Demographics by 2 or more Vehicles in Household
Demographics Similar to Immigrants from Middle Africa by 2 or more Vehicles in Household
In terms of 2 or more vehicles in household, the demographic groups most similar to Immigrants from Middle Africa are Immigrants from Switzerland (53.4%, a difference of 0.030%), Immigrants from Guatemala (53.5%, a difference of 0.090%), Ugandan (53.5%, a difference of 0.090%), Indonesian (53.4%, a difference of 0.10%), and Panamanian (53.5%, a difference of 0.16%).
| Demographics | Rating | Rank | 2 or more Vehicles in Household |
| Alaska Natives | 3.9 /100 | #228 | Tragic 53.6% |
| Immigrants | Turkey | 3.8 /100 | #229 | Tragic 53.6% |
| Immigrants | Nepal | 3.6 /100 | #230 | Tragic 53.5% |
| Panamanians | 3.4 /100 | #231 | Tragic 53.5% |
| Immigrants | Guatemala | 3.2 /100 | #232 | Tragic 53.5% |
| Ugandans | 3.2 /100 | #233 | Tragic 53.5% |
| Immigrants | Switzerland | 3.0 /100 | #234 | Tragic 53.4% |
| Immigrants | Middle Africa | 3.0 /100 | #235 | Tragic 53.4% |
| Indonesians | 2.7 /100 | #236 | Tragic 53.4% |
| Macedonians | 2.4 /100 | #237 | Tragic 53.3% |
| Immigrants | Armenia | 2.3 /100 | #238 | Tragic 53.3% |
| Cambodians | 2.3 /100 | #239 | Tragic 53.3% |
| Immigrants | Europe | 2.1 /100 | #240 | Tragic 53.2% |
| Immigrants | Sierra Leone | 2.1 /100 | #241 | Tragic 53.2% |
| Immigrants | Eastern Asia | 2.1 /100 | #242 | Tragic 53.2% |
Demographics Similar to Immigrants from Caribbean by 2 or more Vehicles in Household
In terms of 2 or more vehicles in household, the demographic groups most similar to Immigrants from Caribbean are Senegalese (44.2%, a difference of 0.020%), Immigrants from Jamaica (44.5%, a difference of 0.57%), Immigrants from Cabo Verde (43.3%, a difference of 2.1%), Immigrants from West Indies (43.1%, a difference of 2.6%), and Immigrants from Senegal (43.0%, a difference of 2.8%).
| Demographics | Rating | Rank | 2 or more Vehicles in Household |
| Cape Verdeans | 0.0 /100 | #316 | Tragic 46.8% |
| Immigrants | Haiti | 0.0 /100 | #317 | Tragic 46.5% |
| Immigrants | Albania | 0.0 /100 | #318 | Tragic 46.0% |
| Jamaicans | 0.0 /100 | #319 | Tragic 45.8% |
| Soviet Union | 0.0 /100 | #320 | Tragic 45.7% |
| Immigrants | Jamaica | 0.0 /100 | #321 | Tragic 44.5% |
| Senegalese | 0.0 /100 | #322 | Tragic 44.2% |
| Immigrants | Caribbean | 0.0 /100 | #323 | Tragic 44.2% |
| Immigrants | Cabo Verde | 0.0 /100 | #324 | Tragic 43.3% |
| Immigrants | West Indies | 0.0 /100 | #325 | Tragic 43.1% |
| Immigrants | Senegal | 0.0 /100 | #326 | Tragic 43.0% |
| Immigrants | Yemen | 0.0 /100 | #327 | Tragic 42.8% |
| Inupiat | 0.0 /100 | #328 | Tragic 42.6% |
| Ecuadorians | 0.0 /100 | #329 | Tragic 42.0% |
| Immigrants | Dominica | 0.0 /100 | #330 | Tragic 41.6% |