Cape Verdean vs Thai No Vehicles in Household
COMPARE
Cape Verdean
Thai
No Vehicles in Household
No Vehicles in Household Comparison
Cape Verdeans
Thais
15.6%
NO VEHICLES IN HOUSEHOLD
0.0/ 100
METRIC RATING
310th/ 347
METRIC RANK
8.2%
NO VEHICLES IN HOUSEHOLD
99.8/ 100
METRIC RATING
61st/ 347
METRIC RANK
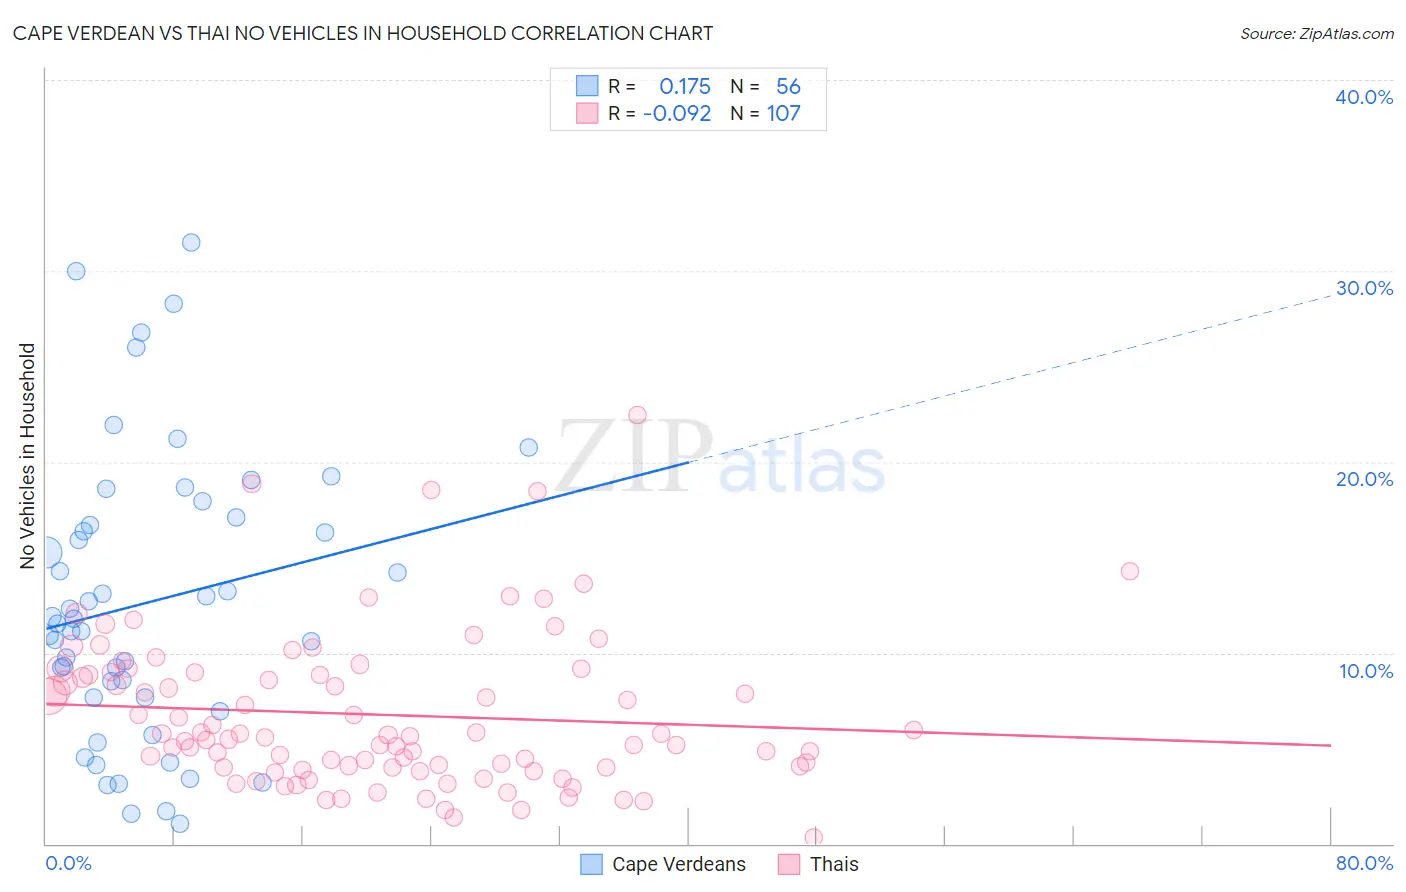
Cape Verdean vs Thai No Vehicles in Household Correlation Chart
The statistical analysis conducted on geographies consisting of 107,427,210 people shows a poor positive correlation between the proportion of Cape Verdeans and percentage of households with no vehicle available in the United States with a correlation coefficient (R) of 0.175 and weighted average of 15.6%. Similarly, the statistical analysis conducted on geographies consisting of 455,165,569 people shows a slight negative correlation between the proportion of Thais and percentage of households with no vehicle available in the United States with a correlation coefficient (R) of -0.092 and weighted average of 8.2%, a difference of 90.3%.
No Vehicles in Household Correlation Summary
| Measurement | Cape Verdean | Thai |
| Minimum | 1.0% | 0.34% |
| Maximum | 31.5% | 22.4% |
| Range | 30.4% | 22.1% |
| Mean | 12.6% | 6.8% |
| Median | 11.6% | 5.6% |
| Interquartile 25% (IQ1) | 7.6% | 4.0% |
| Interquartile 75% (IQ3) | 16.9% | 9.0% |
| Interquartile Range (IQR) | 9.2% | 5.0% |
| Standard Deviation (Sample) | 7.4% | 4.0% |
| Standard Deviation (Population) | 7.3% | 4.0% |
Similar Demographics by No Vehicles in Household
Demographics Similar to Cape Verdeans by No Vehicles in Household
In terms of no vehicles in household, the demographic groups most similar to Cape Verdeans are Immigrants from Israel (15.6%, a difference of 0.010%), Alaskan Athabascan (15.6%, a difference of 0.16%), Tohono O'odham (15.6%, a difference of 0.31%), Albanian (15.6%, a difference of 0.48%), and Puerto Rican (15.5%, a difference of 0.56%).
| Demographics | Rating | Rank | No Vehicles in Household |
| Immigrants | Western Africa | 0.0 /100 | #303 | Tragic 15.0% |
| Immigrants | Russia | 0.0 /100 | #304 | Tragic 15.1% |
| Immigrants | China | 0.0 /100 | #305 | Tragic 15.2% |
| Immigrants | Belize | 0.0 /100 | #306 | Tragic 15.4% |
| Immigrants | Haiti | 0.0 /100 | #307 | Tragic 15.4% |
| U.S. Virgin Islanders | 0.0 /100 | #308 | Tragic 15.4% |
| Puerto Ricans | 0.0 /100 | #309 | Tragic 15.5% |
| Cape Verdeans | 0.0 /100 | #310 | Tragic 15.6% |
| Immigrants | Israel | 0.0 /100 | #311 | Tragic 15.6% |
| Alaskan Athabascans | 0.0 /100 | #312 | Tragic 15.6% |
| Tohono O'odham | 0.0 /100 | #313 | Tragic 15.6% |
| Albanians | 0.0 /100 | #314 | Tragic 15.6% |
| Cypriots | 0.0 /100 | #315 | Tragic 15.7% |
| Ghanaians | 0.0 /100 | #316 | Tragic 16.4% |
| Immigrants | Ghana | 0.0 /100 | #317 | Tragic 16.6% |
Demographics Similar to Thais by No Vehicles in Household
In terms of no vehicles in household, the demographic groups most similar to Thais are Immigrants from Laos (8.2%, a difference of 0.17%), Immigrants from India (8.2%, a difference of 0.24%), Chinese (8.2%, a difference of 0.46%), Immigrants from Mexico (8.1%, a difference of 0.59%), and Venezuelan (8.1%, a difference of 0.69%).
| Demographics | Rating | Rank | No Vehicles in Household |
| Immigrants | Venezuela | 99.9 /100 | #54 | Exceptional 8.1% |
| Celtics | 99.9 /100 | #55 | Exceptional 8.1% |
| Immigrants | Afghanistan | 99.9 /100 | #56 | Exceptional 8.1% |
| Venezuelans | 99.8 /100 | #57 | Exceptional 8.1% |
| Immigrants | Mexico | 99.8 /100 | #58 | Exceptional 8.1% |
| Immigrants | India | 99.8 /100 | #59 | Exceptional 8.2% |
| Immigrants | Laos | 99.8 /100 | #60 | Exceptional 8.2% |
| Thais | 99.8 /100 | #61 | Exceptional 8.2% |
| Chinese | 99.8 /100 | #62 | Exceptional 8.2% |
| Slovaks | 99.8 /100 | #63 | Exceptional 8.3% |
| Croatians | 99.8 /100 | #64 | Exceptional 8.3% |
| Canadians | 99.7 /100 | #65 | Exceptional 8.3% |
| Palestinians | 99.7 /100 | #66 | Exceptional 8.3% |
| Immigrants | Scotland | 99.7 /100 | #67 | Exceptional 8.3% |
| Immigrants | Iran | 99.7 /100 | #68 | Exceptional 8.4% |