Immigrants from Burma/Myanmar vs Thai In Labor Force | Age 16-19
COMPARE
Immigrants from Burma/Myanmar
Thai
In Labor Force | Age 16-19
In Labor Force | Age 16-19 Comparison
Immigrants from Burma/Myanmar
Thais
39.0%
IN LABOR FORCE | AGE 16-19
99.5/ 100
METRIC RATING
90th/ 347
METRIC RANK
34.6%
IN LABOR FORCE | AGE 16-19
1.2/ 100
METRIC RATING
258th/ 347
METRIC RANK
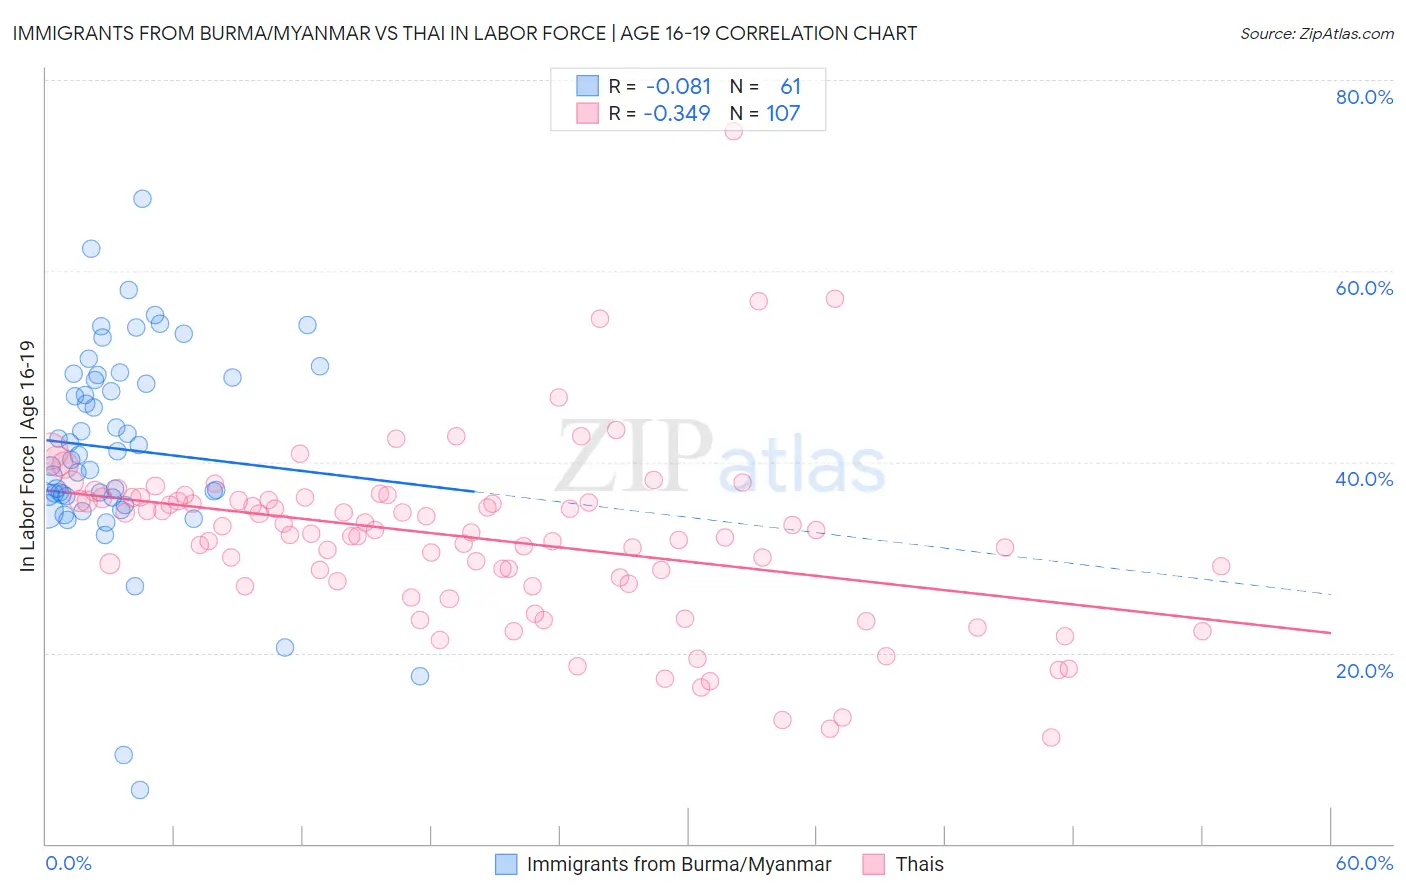
Immigrants from Burma/Myanmar vs Thai In Labor Force | Age 16-19 Correlation Chart
The statistical analysis conducted on geographies consisting of 172,320,097 people shows a slight negative correlation between the proportion of Immigrants from Burma/Myanmar and labor force participation rate among population between the ages 16 and 19 in the United States with a correlation coefficient (R) of -0.081 and weighted average of 39.0%. Similarly, the statistical analysis conducted on geographies consisting of 474,909,482 people shows a mild negative correlation between the proportion of Thais and labor force participation rate among population between the ages 16 and 19 in the United States with a correlation coefficient (R) of -0.349 and weighted average of 34.6%, a difference of 13.0%.
In Labor Force | Age 16-19 Correlation Summary
| Measurement | Immigrants from Burma/Myanmar | Thai |
| Minimum | 5.6% | 11.1% |
| Maximum | 67.6% | 74.6% |
| Range | 62.0% | 63.5% |
| Mean | 41.3% | 32.0% |
| Median | 40.7% | 32.6% |
| Interquartile 25% (IQ1) | 36.3% | 27.3% |
| Interquartile 75% (IQ3) | 49.0% | 36.2% |
| Interquartile Range (IQR) | 12.7% | 9.0% |
| Standard Deviation (Sample) | 11.1% | 9.4% |
| Standard Deviation (Population) | 11.0% | 9.4% |
Similar Demographics by In Labor Force | Age 16-19
Demographics Similar to Immigrants from Burma/Myanmar by In Labor Force | Age 16-19
In terms of in labor force | age 16-19, the demographic groups most similar to Immigrants from Burma/Myanmar are Alaska Native (39.1%, a difference of 0.080%), Puget Sound Salish (39.1%, a difference of 0.090%), Spanish American (39.0%, a difference of 0.15%), Immigrants from Germany (39.1%, a difference of 0.16%), and Osage (39.0%, a difference of 0.23%).
| Demographics | Rating | Rank | In Labor Force | Age 16-19 |
| Spanish | 99.7 /100 | #83 | Exceptional 39.3% |
| Immigrants | Uganda | 99.7 /100 | #84 | Exceptional 39.2% |
| Creek | 99.6 /100 | #85 | Exceptional 39.1% |
| Samoans | 99.6 /100 | #86 | Exceptional 39.1% |
| Immigrants | Germany | 99.6 /100 | #87 | Exceptional 39.1% |
| Puget Sound Salish | 99.6 /100 | #88 | Exceptional 39.1% |
| Alaska Natives | 99.6 /100 | #89 | Exceptional 39.1% |
| Immigrants | Burma/Myanmar | 99.5 /100 | #90 | Exceptional 39.0% |
| Spanish Americans | 99.5 /100 | #91 | Exceptional 39.0% |
| Osage | 99.4 /100 | #92 | Exceptional 39.0% |
| Blackfeet | 99.4 /100 | #93 | Exceptional 38.9% |
| Immigrants | Canada | 99.4 /100 | #94 | Exceptional 38.9% |
| Immigrants | North America | 99.4 /100 | #95 | Exceptional 38.9% |
| Latvians | 99.4 /100 | #96 | Exceptional 38.9% |
| Greeks | 99.3 /100 | #97 | Exceptional 38.9% |
Demographics Similar to Thais by In Labor Force | Age 16-19
In terms of in labor force | age 16-19, the demographic groups most similar to Thais are Immigrants from South Central Asia (34.6%, a difference of 0.010%), Immigrants from Egypt (34.6%, a difference of 0.010%), Immigrants (34.6%, a difference of 0.020%), Egyptian (34.5%, a difference of 0.10%), and Peruvian (34.6%, a difference of 0.12%).
| Demographics | Rating | Rank | In Labor Force | Age 16-19 |
| Immigrants | Western Asia | 2.0 /100 | #251 | Tragic 34.8% |
| Immigrants | Chile | 2.0 /100 | #252 | Tragic 34.8% |
| Immigrants | Japan | 1.5 /100 | #253 | Tragic 34.7% |
| Bahamians | 1.4 /100 | #254 | Tragic 34.6% |
| Peruvians | 1.4 /100 | #255 | Tragic 34.6% |
| Immigrants | South Central Asia | 1.3 /100 | #256 | Tragic 34.6% |
| Immigrants | Egypt | 1.2 /100 | #257 | Tragic 34.6% |
| Thais | 1.2 /100 | #258 | Tragic 34.6% |
| Immigrants | Immigrants | 1.2 /100 | #259 | Tragic 34.6% |
| Egyptians | 1.2 /100 | #260 | Tragic 34.5% |
| Salvadorans | 1.1 /100 | #261 | Tragic 34.5% |
| Hispanics or Latinos | 1.1 /100 | #262 | Tragic 34.5% |
| Burmese | 1.1 /100 | #263 | Tragic 34.5% |
| Immigrants | Uruguay | 0.9 /100 | #264 | Tragic 34.4% |
| Immigrants | El Salvador | 0.7 /100 | #265 | Tragic 34.3% |