Immigrants from Burma/Myanmar vs Thai Disability
COMPARE
Immigrants from Burma/Myanmar
Thai
Disability
Disability Comparison
Immigrants from Burma/Myanmar
Thais
11.8%
DISABILITY
28.5/ 100
METRIC RATING
185th/ 347
METRIC RANK
9.7%
DISABILITY
100.0/ 100
METRIC RATING
4th/ 347
METRIC RANK
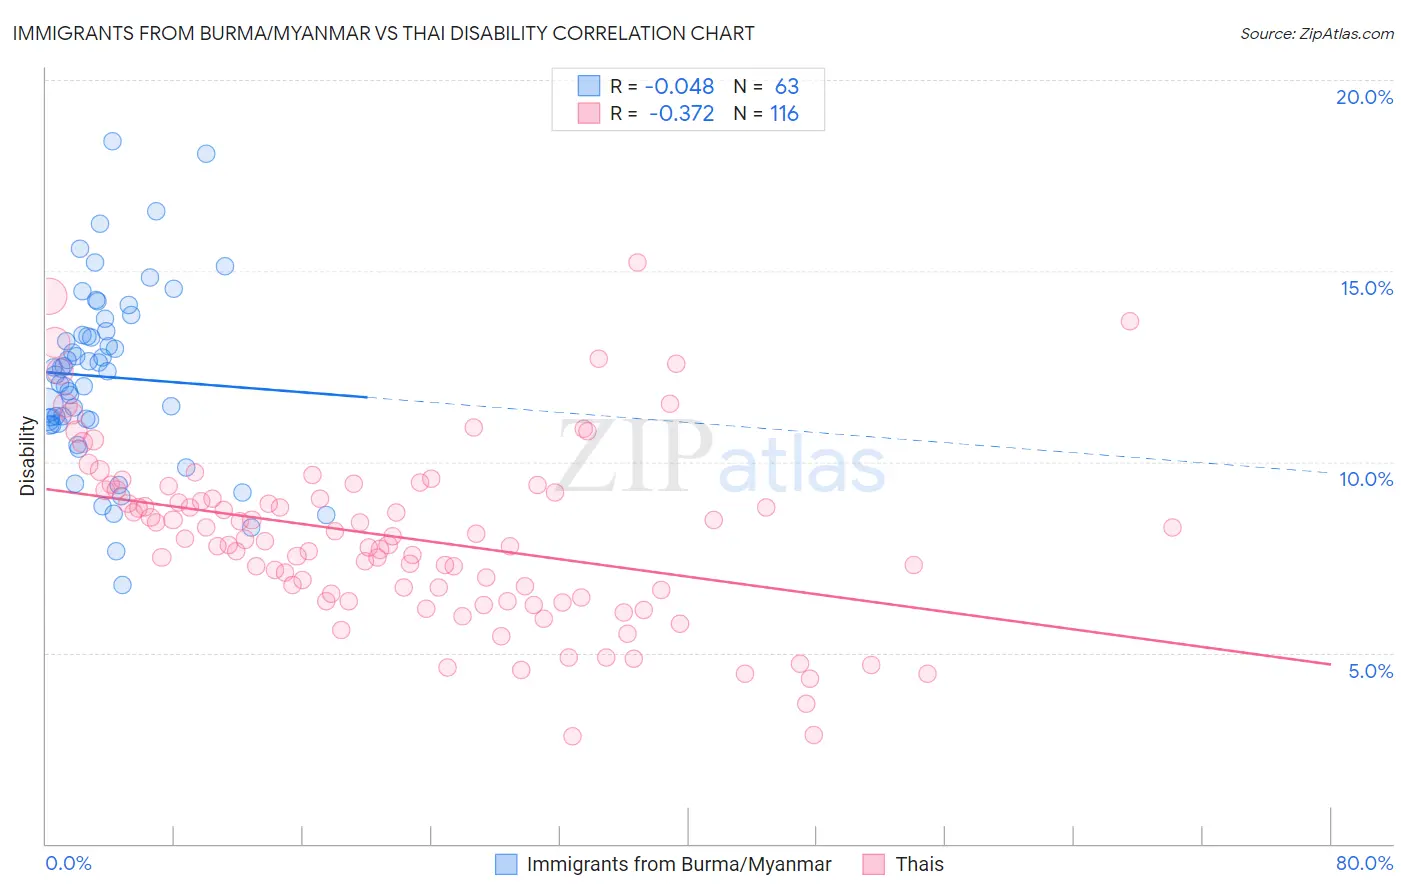
Immigrants from Burma/Myanmar vs Thai Disability Correlation Chart
The statistical analysis conducted on geographies consisting of 172,347,454 people shows no correlation between the proportion of Immigrants from Burma/Myanmar and percentage of population with a disability in the United States with a correlation coefficient (R) of -0.048 and weighted average of 11.8%. Similarly, the statistical analysis conducted on geographies consisting of 475,831,416 people shows a mild negative correlation between the proportion of Thais and percentage of population with a disability in the United States with a correlation coefficient (R) of -0.372 and weighted average of 9.7%, a difference of 21.8%.
Disability Correlation Summary
| Measurement | Immigrants from Burma/Myanmar | Thai |
| Minimum | 6.8% | 2.8% |
| Maximum | 18.4% | 15.2% |
| Range | 11.6% | 12.4% |
| Mean | 12.2% | 8.0% |
| Median | 12.4% | 7.9% |
| Interquartile 25% (IQ1) | 11.0% | 6.5% |
| Interquartile 75% (IQ3) | 13.4% | 9.2% |
| Interquartile Range (IQR) | 2.4% | 2.7% |
| Standard Deviation (Sample) | 2.3% | 2.3% |
| Standard Deviation (Population) | 2.3% | 2.3% |
Similar Demographics by Disability
Demographics Similar to Immigrants from Burma/Myanmar by Disability
In terms of disability, the demographic groups most similar to Immigrants from Burma/Myanmar are Immigrants from Scotland (11.8%, a difference of 0.010%), Lebanese (11.8%, a difference of 0.030%), Iraqi (11.8%, a difference of 0.080%), Honduran (11.8%, a difference of 0.14%), and Immigrants from Mexico (11.9%, a difference of 0.27%).
| Demographics | Rating | Rank | Disability |
| Greeks | 46.2 /100 | #178 | Average 11.7% |
| Immigrants | Armenia | 41.9 /100 | #179 | Average 11.7% |
| Immigrants | Honduras | 37.8 /100 | #180 | Fair 11.8% |
| Immigrants | Oceania | 34.3 /100 | #181 | Fair 11.8% |
| Icelanders | 34.0 /100 | #182 | Fair 11.8% |
| Hondurans | 31.2 /100 | #183 | Fair 11.8% |
| Iraqis | 30.0 /100 | #184 | Fair 11.8% |
| Immigrants | Burma/Myanmar | 28.5 /100 | #185 | Fair 11.8% |
| Immigrants | Scotland | 28.2 /100 | #186 | Fair 11.8% |
| Lebanese | 27.9 /100 | #187 | Fair 11.8% |
| Immigrants | Mexico | 23.8 /100 | #188 | Fair 11.9% |
| Immigrants | Zaire | 21.8 /100 | #189 | Fair 11.9% |
| Immigrants | West Indies | 21.1 /100 | #190 | Fair 11.9% |
| Ute | 19.5 /100 | #191 | Poor 11.9% |
| Lithuanians | 18.8 /100 | #192 | Poor 11.9% |
Demographics Similar to Thais by Disability
In terms of disability, the demographic groups most similar to Thais are Immigrants from Taiwan (9.6%, a difference of 1.1%), Filipino (9.6%, a difference of 1.1%), Immigrants from Bolivia (9.9%, a difference of 1.6%), Immigrants from India (9.5%, a difference of 2.1%), and Immigrants from South Central Asia (9.9%, a difference of 2.5%).
| Demographics | Rating | Rank | Disability |
| Immigrants | India | 100.0 /100 | #1 | Exceptional 9.5% |
| Filipinos | 100.0 /100 | #2 | Exceptional 9.6% |
| Immigrants | Taiwan | 100.0 /100 | #3 | Exceptional 9.6% |
| Thais | 100.0 /100 | #4 | Exceptional 9.7% |
| Immigrants | Bolivia | 100.0 /100 | #5 | Exceptional 9.9% |
| Immigrants | South Central Asia | 100.0 /100 | #6 | Exceptional 9.9% |
| Immigrants | Singapore | 100.0 /100 | #7 | Exceptional 10.0% |
| Bolivians | 100.0 /100 | #8 | Exceptional 10.0% |
| Immigrants | Hong Kong | 100.0 /100 | #9 | Exceptional 10.0% |
| Immigrants | China | 100.0 /100 | #10 | Exceptional 10.1% |
| Iranians | 100.0 /100 | #11 | Exceptional 10.1% |
| Immigrants | Israel | 100.0 /100 | #12 | Exceptional 10.1% |
| Immigrants | Eastern Asia | 100.0 /100 | #13 | Exceptional 10.2% |
| Immigrants | Korea | 100.0 /100 | #14 | Exceptional 10.2% |
| Okinawans | 100.0 /100 | #15 | Exceptional 10.3% |