Creek vs Thai No Vehicles in Household
COMPARE
Creek
Thai
No Vehicles in Household
No Vehicles in Household Comparison
Creek
Thais
7.8%
NO VEHICLES IN HOUSEHOLD
99.9/ 100
METRIC RATING
38th/ 347
METRIC RANK
8.2%
NO VEHICLES IN HOUSEHOLD
99.8/ 100
METRIC RATING
61st/ 347
METRIC RANK
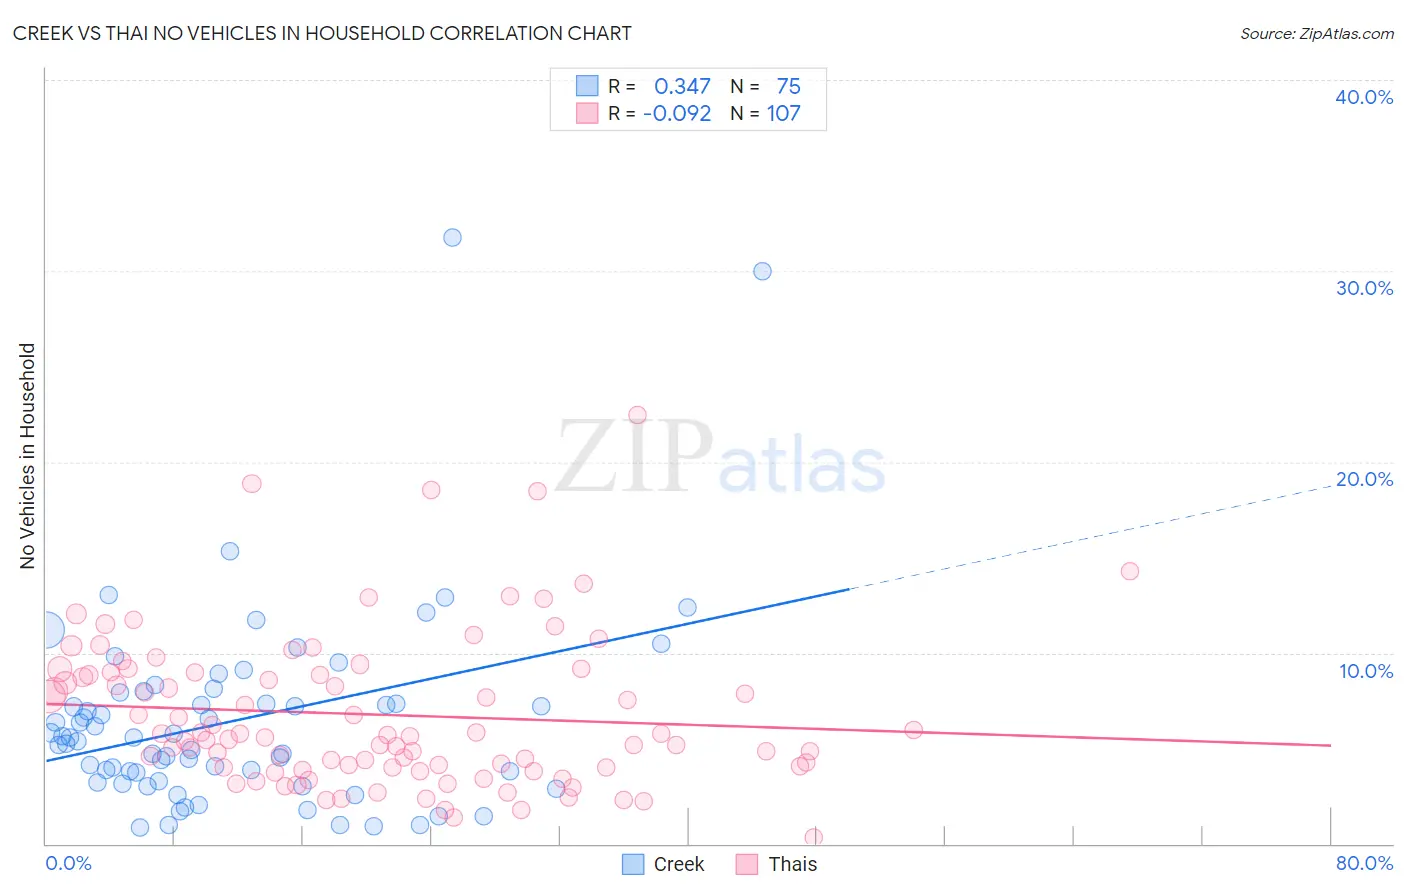
Creek vs Thai No Vehicles in Household Correlation Chart
The statistical analysis conducted on geographies consisting of 178,241,214 people shows a mild positive correlation between the proportion of Creek and percentage of households with no vehicle available in the United States with a correlation coefficient (R) of 0.347 and weighted average of 7.8%. Similarly, the statistical analysis conducted on geographies consisting of 455,165,569 people shows a slight negative correlation between the proportion of Thais and percentage of households with no vehicle available in the United States with a correlation coefficient (R) of -0.092 and weighted average of 8.2%, a difference of 5.2%.
No Vehicles in Household Correlation Summary
| Measurement | Creek | Thai |
| Minimum | 0.83% | 0.34% |
| Maximum | 31.7% | 22.4% |
| Range | 30.9% | 22.1% |
| Mean | 6.4% | 6.8% |
| Median | 5.5% | 5.6% |
| Interquartile 25% (IQ1) | 3.2% | 4.0% |
| Interquartile 75% (IQ3) | 7.9% | 9.0% |
| Interquartile Range (IQR) | 4.7% | 5.0% |
| Standard Deviation (Sample) | 5.2% | 4.0% |
| Standard Deviation (Population) | 5.2% | 4.0% |
Similar Demographics by No Vehicles in Household
Demographics Similar to Creek by No Vehicles in Household
In terms of no vehicles in household, the demographic groups most similar to Creek are Basque (7.8%, a difference of 0.14%), Iraqi (7.7%, a difference of 0.39%), Cherokee (7.7%, a difference of 0.52%), Immigrants from Fiji (7.8%, a difference of 0.58%), and Immigrants from Vietnam (7.7%, a difference of 0.67%).
| Demographics | Rating | Rank | No Vehicles in Household |
| Native Hawaiians | 100.0 /100 | #31 | Exceptional 7.7% |
| Malaysians | 100.0 /100 | #32 | Exceptional 7.7% |
| Immigrants | Taiwan | 100.0 /100 | #33 | Exceptional 7.7% |
| Immigrants | Vietnam | 100.0 /100 | #34 | Exceptional 7.7% |
| Cherokee | 99.9 /100 | #35 | Exceptional 7.7% |
| Iraqis | 99.9 /100 | #36 | Exceptional 7.7% |
| Basques | 99.9 /100 | #37 | Exceptional 7.8% |
| Creek | 99.9 /100 | #38 | Exceptional 7.8% |
| Immigrants | Fiji | 99.9 /100 | #39 | Exceptional 7.8% |
| Czechoslovakians | 99.9 /100 | #40 | Exceptional 7.8% |
| French Canadians | 99.9 /100 | #41 | Exceptional 7.8% |
| Swiss | 99.9 /100 | #42 | Exceptional 7.9% |
| Chickasaw | 99.9 /100 | #43 | Exceptional 7.9% |
| Choctaw | 99.9 /100 | #44 | Exceptional 7.9% |
| Immigrants | Nonimmigrants | 99.9 /100 | #45 | Exceptional 7.9% |
Demographics Similar to Thais by No Vehicles in Household
In terms of no vehicles in household, the demographic groups most similar to Thais are Immigrants from Laos (8.2%, a difference of 0.17%), Immigrants from India (8.2%, a difference of 0.24%), Chinese (8.2%, a difference of 0.46%), Immigrants from Mexico (8.1%, a difference of 0.59%), and Venezuelan (8.1%, a difference of 0.69%).
| Demographics | Rating | Rank | No Vehicles in Household |
| Immigrants | Venezuela | 99.9 /100 | #54 | Exceptional 8.1% |
| Celtics | 99.9 /100 | #55 | Exceptional 8.1% |
| Immigrants | Afghanistan | 99.9 /100 | #56 | Exceptional 8.1% |
| Venezuelans | 99.8 /100 | #57 | Exceptional 8.1% |
| Immigrants | Mexico | 99.8 /100 | #58 | Exceptional 8.1% |
| Immigrants | India | 99.8 /100 | #59 | Exceptional 8.2% |
| Immigrants | Laos | 99.8 /100 | #60 | Exceptional 8.2% |
| Thais | 99.8 /100 | #61 | Exceptional 8.2% |
| Chinese | 99.8 /100 | #62 | Exceptional 8.2% |
| Slovaks | 99.8 /100 | #63 | Exceptional 8.3% |
| Croatians | 99.8 /100 | #64 | Exceptional 8.3% |
| Canadians | 99.7 /100 | #65 | Exceptional 8.3% |
| Palestinians | 99.7 /100 | #66 | Exceptional 8.3% |
| Immigrants | Scotland | 99.7 /100 | #67 | Exceptional 8.3% |
| Immigrants | Iran | 99.7 /100 | #68 | Exceptional 8.4% |