Alaskan Athabascan vs Luxembourger 2 or more Vehicles in Household
COMPARE
Alaskan Athabascan
Luxembourger
2 or more Vehicles in Household
2 or more Vehicles in Household Comparison
Alaskan Athabascans
Luxembourgers
55.2%
2 OR MORE VEHICLES IN HOUSEHOLD
42.9/ 100
METRIC RATING
179th/ 347
METRIC RANK
59.1%
2 OR MORE VEHICLES IN HOUSEHOLD
99.9/ 100
METRIC RATING
55th/ 347
METRIC RANK
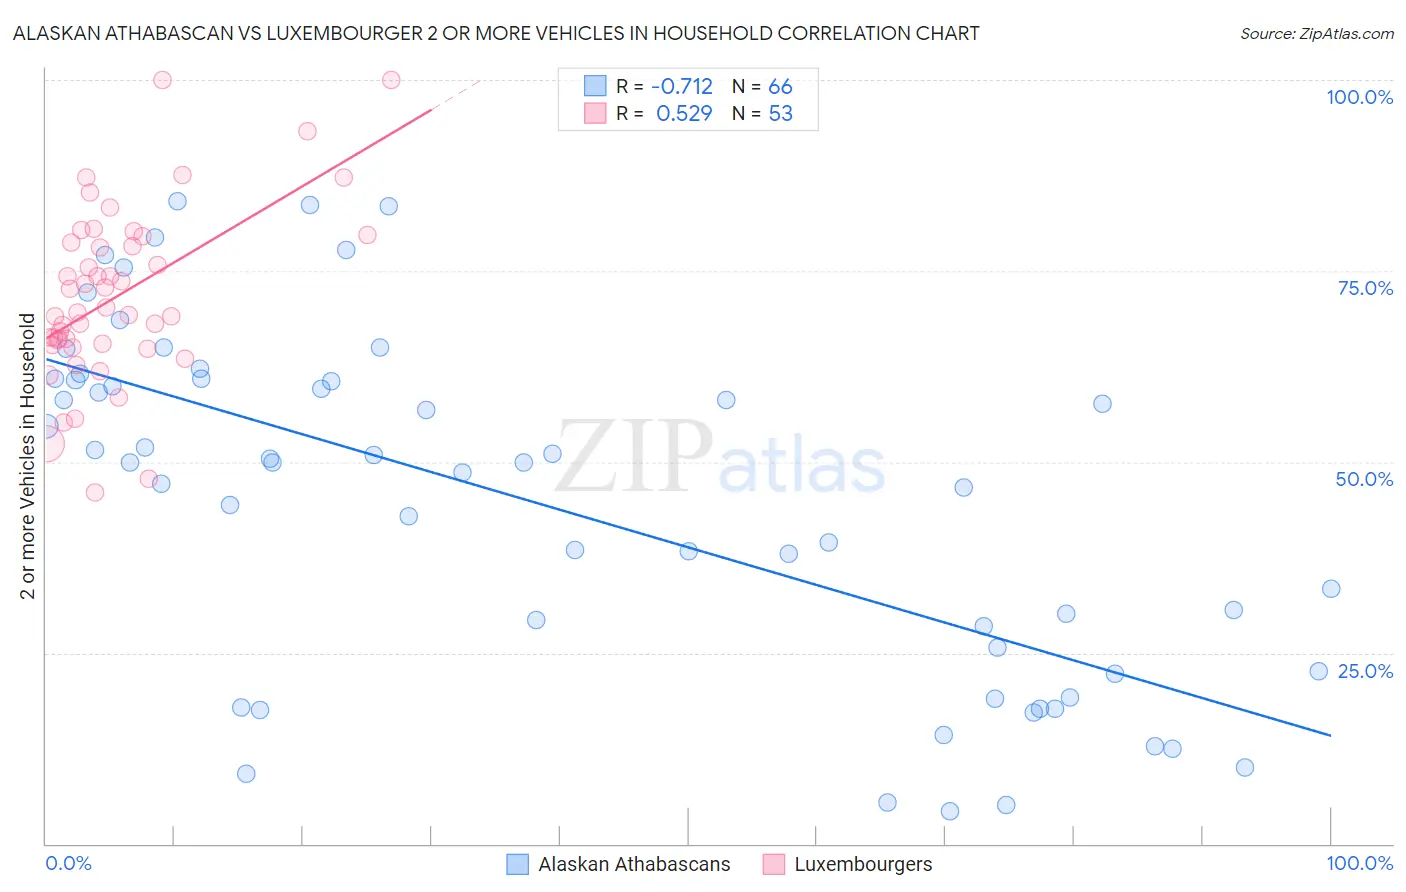
Alaskan Athabascan vs Luxembourger 2 or more Vehicles in Household Correlation Chart
The statistical analysis conducted on geographies consisting of 45,808,386 people shows a strong negative correlation between the proportion of Alaskan Athabascans and percentage of households with 2 or more vehicles available in the United States with a correlation coefficient (R) of -0.712 and weighted average of 55.2%. Similarly, the statistical analysis conducted on geographies consisting of 144,657,746 people shows a substantial positive correlation between the proportion of Luxembourgers and percentage of households with 2 or more vehicles available in the United States with a correlation coefficient (R) of 0.529 and weighted average of 59.1%, a difference of 7.0%.
2 or more Vehicles in Household Correlation Summary
| Measurement | Alaskan Athabascan | Luxembourger |
| Minimum | 4.3% | 46.0% |
| Maximum | 84.1% | 100.0% |
| Range | 79.8% | 54.0% |
| Mean | 44.5% | 71.7% |
| Median | 50.0% | 69.5% |
| Interquartile 25% (IQ1) | 22.6% | 65.4% |
| Interquartile 75% (IQ3) | 60.8% | 79.1% |
| Interquartile Range (IQR) | 38.2% | 13.7% |
| Standard Deviation (Sample) | 22.4% | 11.4% |
| Standard Deviation (Population) | 22.2% | 11.3% |
Similar Demographics by 2 or more Vehicles in Household
Demographics Similar to Alaskan Athabascans by 2 or more Vehicles in Household
In terms of 2 or more vehicles in household, the demographic groups most similar to Alaskan Athabascans are Immigrants from Sweden (55.2%, a difference of 0.10%), Immigrants from Kenya (55.1%, a difference of 0.11%), Menominee (55.3%, a difference of 0.13%), Immigrants from Cuba (55.3%, a difference of 0.17%), and Immigrants from Micronesia (55.1%, a difference of 0.20%).
| Demographics | Rating | Rank | 2 or more Vehicles in Household |
| Immigrants | Nicaragua | 51.6 /100 | #172 | Average 55.4% |
| Immigrants | Western Europe | 51.4 /100 | #173 | Average 55.4% |
| Navajo | 50.0 /100 | #174 | Average 55.3% |
| Immigrants | Denmark | 49.4 /100 | #175 | Average 55.3% |
| Immigrants | Cuba | 47.0 /100 | #176 | Average 55.3% |
| Menominee | 46.2 /100 | #177 | Average 55.3% |
| Immigrants | Sweden | 45.3 /100 | #178 | Average 55.2% |
| Alaskan Athabascans | 42.9 /100 | #179 | Average 55.2% |
| Immigrants | Kenya | 40.4 /100 | #180 | Average 55.1% |
| Immigrants | Micronesia | 38.2 /100 | #181 | Fair 55.1% |
| Cree | 38.2 /100 | #182 | Fair 55.1% |
| Immigrants | Cameroon | 37.3 /100 | #183 | Fair 55.1% |
| Apache | 36.7 /100 | #184 | Fair 55.1% |
| Arabs | 35.9 /100 | #185 | Fair 55.0% |
| Peruvians | 33.7 /100 | #186 | Fair 55.0% |
Demographics Similar to Luxembourgers by 2 or more Vehicles in Household
In terms of 2 or more vehicles in household, the demographic groups most similar to Luxembourgers are Bhutanese (59.1%, a difference of 0.030%), Chickasaw (59.0%, a difference of 0.11%), Afghan (59.0%, a difference of 0.11%), Celtic (59.2%, a difference of 0.18%), and Spaniard (59.2%, a difference of 0.19%).
| Demographics | Rating | Rank | 2 or more Vehicles in Household |
| Immigrants | India | 99.9 /100 | #48 | Exceptional 59.3% |
| Belgians | 99.9 /100 | #49 | Exceptional 59.3% |
| Choctaw | 99.9 /100 | #50 | Exceptional 59.3% |
| Spaniards | 99.9 /100 | #51 | Exceptional 59.2% |
| Immigrants | Laos | 99.9 /100 | #52 | Exceptional 59.2% |
| Celtics | 99.9 /100 | #53 | Exceptional 59.2% |
| Bhutanese | 99.9 /100 | #54 | Exceptional 59.1% |
| Luxembourgers | 99.9 /100 | #55 | Exceptional 59.1% |
| Chickasaw | 99.9 /100 | #56 | Exceptional 59.0% |
| Afghans | 99.9 /100 | #57 | Exceptional 59.0% |
| Immigrants | Scotland | 99.8 /100 | #58 | Exceptional 58.9% |
| Spanish Americans | 99.8 /100 | #59 | Exceptional 58.9% |
| French Canadians | 99.8 /100 | #60 | Exceptional 58.9% |
| Osage | 99.8 /100 | #61 | Exceptional 58.8% |
| Immigrants | Nonimmigrants | 99.8 /100 | #62 | Exceptional 58.8% |