Immigrants from Burma/Myanmar vs Immigrants from Ghana Bachelor's Degree
COMPARE
Immigrants from Burma/Myanmar
Immigrants from Ghana
Bachelor's Degree
Bachelor's Degree Comparison
Immigrants from Burma/Myanmar
Immigrants from Ghana
35.5%
BACHELOR'S DEGREE
7.3/ 100
METRIC RATING
225th/ 347
METRIC RANK
36.9%
BACHELOR'S DEGREE
27.4/ 100
METRIC RATING
200th/ 347
METRIC RANK
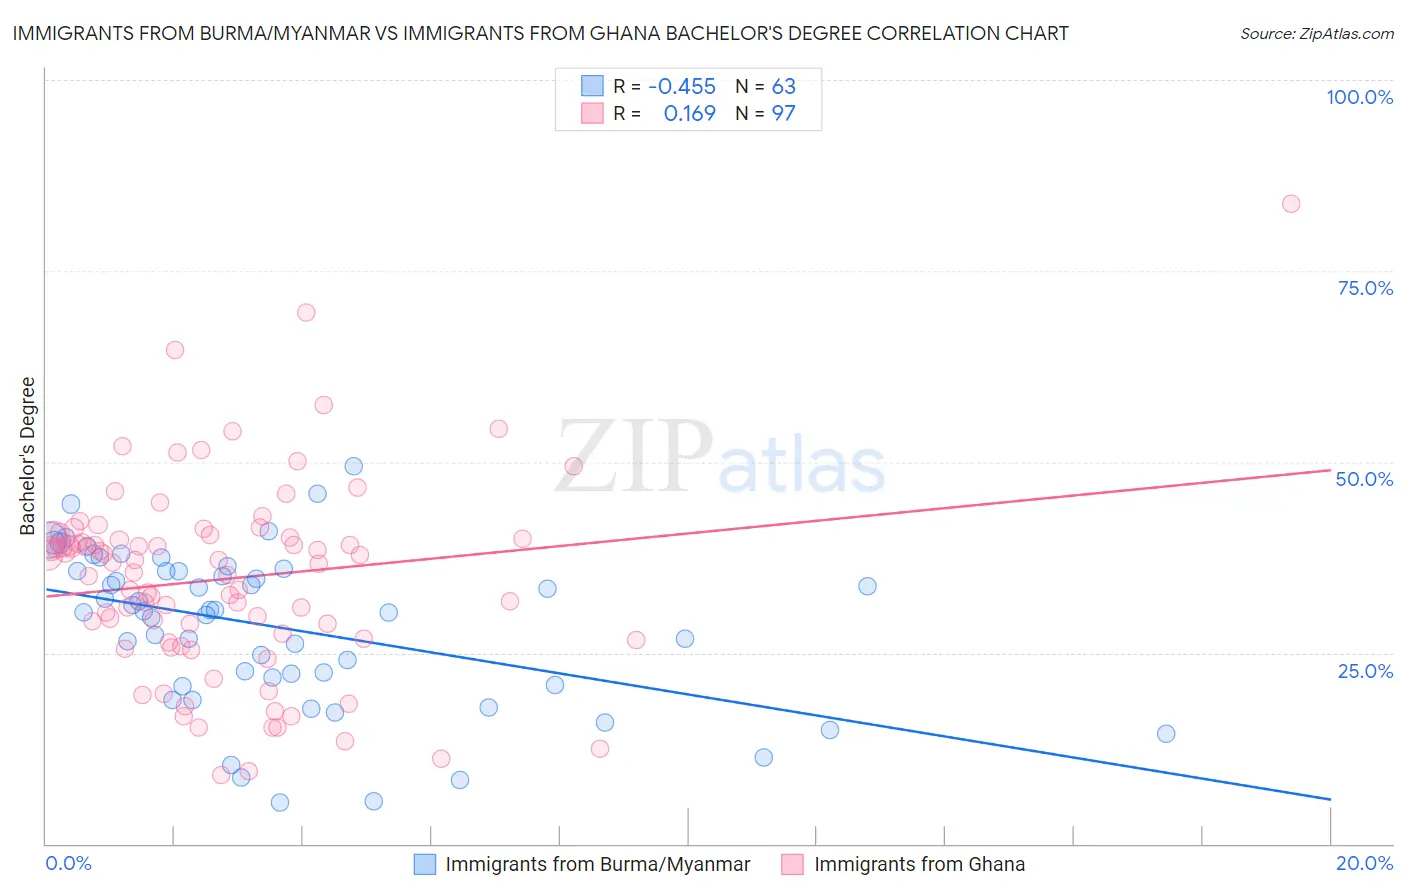
Immigrants from Burma/Myanmar vs Immigrants from Ghana Bachelor's Degree Correlation Chart
The statistical analysis conducted on geographies consisting of 172,337,344 people shows a moderate negative correlation between the proportion of Immigrants from Burma/Myanmar and percentage of population with at least bachelor's degree education in the United States with a correlation coefficient (R) of -0.455 and weighted average of 35.5%. Similarly, the statistical analysis conducted on geographies consisting of 199,935,745 people shows a poor positive correlation between the proportion of Immigrants from Ghana and percentage of population with at least bachelor's degree education in the United States with a correlation coefficient (R) of 0.169 and weighted average of 36.9%, a difference of 4.1%.
Bachelor's Degree Correlation Summary
| Measurement | Immigrants from Burma/Myanmar | Immigrants from Ghana |
| Minimum | 5.5% | 9.1% |
| Maximum | 49.5% | 83.8% |
| Range | 44.0% | 74.7% |
| Mean | 28.4% | 34.7% |
| Median | 30.5% | 36.8% |
| Interquartile 25% (IQ1) | 20.8% | 26.7% |
| Interquartile 75% (IQ3) | 35.8% | 40.3% |
| Interquartile Range (IQR) | 15.0% | 13.5% |
| Standard Deviation (Sample) | 10.3% | 12.8% |
| Standard Deviation (Population) | 10.2% | 12.7% |
Similar Demographics by Bachelor's Degree
Demographics Similar to Immigrants from Burma/Myanmar by Bachelor's Degree
In terms of bachelor's degree, the demographic groups most similar to Immigrants from Burma/Myanmar are Portuguese (35.5%, a difference of 0.040%), Immigrants from Barbados (35.5%, a difference of 0.070%), Ecuadorian (35.4%, a difference of 0.30%), French Canadian (35.6%, a difference of 0.35%), and Trinidadian and Tobagonian (35.7%, a difference of 0.52%).
| Demographics | Rating | Rank | Bachelor's Degree |
| Sub-Saharan Africans | 9.8 /100 | #218 | Tragic 35.8% |
| West Indians | 9.7 /100 | #219 | Tragic 35.8% |
| Spanish | 9.6 /100 | #220 | Tragic 35.8% |
| Dutch | 9.2 /100 | #221 | Tragic 35.7% |
| Trinidadians and Tobagonians | 8.8 /100 | #222 | Tragic 35.7% |
| French Canadians | 8.3 /100 | #223 | Tragic 35.6% |
| Immigrants | Barbados | 7.5 /100 | #224 | Tragic 35.5% |
| Immigrants | Burma/Myanmar | 7.3 /100 | #225 | Tragic 35.5% |
| Portuguese | 7.2 /100 | #226 | Tragic 35.5% |
| Ecuadorians | 6.6 /100 | #227 | Tragic 35.4% |
| Immigrants | Trinidad and Tobago | 6.0 /100 | #228 | Tragic 35.3% |
| Whites/Caucasians | 5.9 /100 | #229 | Tragic 35.3% |
| Immigrants | Grenada | 4.3 /100 | #230 | Tragic 35.0% |
| Immigrants | St. Vincent and the Grenadines | 4.3 /100 | #231 | Tragic 35.0% |
| Hmong | 3.4 /100 | #232 | Tragic 34.8% |
Demographics Similar to Immigrants from Ghana by Bachelor's Degree
In terms of bachelor's degree, the demographic groups most similar to Immigrants from Ghana are Immigrants from Costa Rica (36.9%, a difference of 0.0%), Welsh (37.0%, a difference of 0.21%), Czechoslovakian (37.0%, a difference of 0.22%), Immigrants from South Eastern Asia (36.8%, a difference of 0.26%), and Celtic (37.0%, a difference of 0.27%).
| Demographics | Rating | Rank | Bachelor's Degree |
| Yugoslavians | 31.5 /100 | #193 | Fair 37.1% |
| Belgians | 29.9 /100 | #194 | Fair 37.0% |
| Koreans | 29.8 /100 | #195 | Fair 37.0% |
| Celtics | 29.5 /100 | #196 | Fair 37.0% |
| Czechoslovakians | 29.2 /100 | #197 | Fair 37.0% |
| Welsh | 29.1 /100 | #198 | Fair 37.0% |
| Immigrants | Costa Rica | 27.4 /100 | #199 | Fair 36.9% |
| Immigrants | Ghana | 27.4 /100 | #200 | Fair 36.9% |
| Immigrants | South Eastern Asia | 25.4 /100 | #201 | Fair 36.8% |
| Immigrants | Zaire | 25.3 /100 | #202 | Fair 36.8% |
| Immigrants | Nigeria | 23.1 /100 | #203 | Fair 36.7% |
| Immigrants | Immigrants | 22.8 /100 | #204 | Fair 36.7% |
| Finns | 22.2 /100 | #205 | Fair 36.7% |
| Spaniards | 21.2 /100 | #206 | Fair 36.6% |
| Immigrants | Middle Africa | 20.6 /100 | #207 | Fair 36.6% |