Immigrants from Bulgaria vs Immigrants from Scotland Median Male Earnings
COMPARE
Immigrants from Bulgaria
Immigrants from Scotland
Median Male Earnings
Median Male Earnings Comparison
Immigrants from Bulgaria
Immigrants from Scotland
$60,358
MEDIAN MALE EARNINGS
99.7/ 100
METRIC RATING
70th/ 347
METRIC RANK
$61,220
MEDIAN MALE EARNINGS
99.9/ 100
METRIC RATING
57th/ 347
METRIC RANK
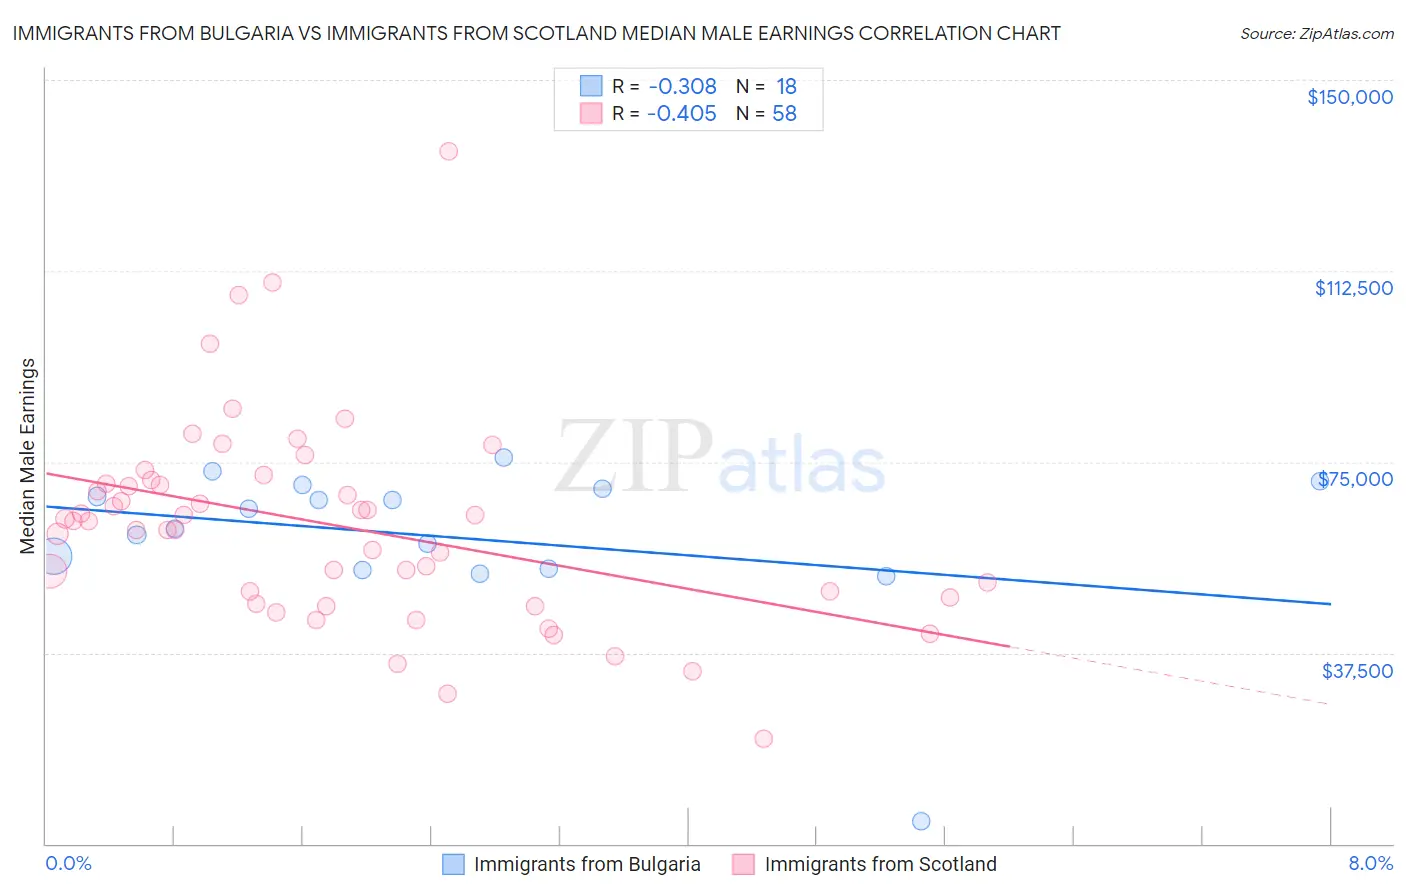
Immigrants from Bulgaria vs Immigrants from Scotland Median Male Earnings Correlation Chart
The statistical analysis conducted on geographies consisting of 172,534,572 people shows a mild negative correlation between the proportion of Immigrants from Bulgaria and median male earnings in the United States with a correlation coefficient (R) of -0.308 and weighted average of $60,358. Similarly, the statistical analysis conducted on geographies consisting of 196,362,899 people shows a moderate negative correlation between the proportion of Immigrants from Scotland and median male earnings in the United States with a correlation coefficient (R) of -0.405 and weighted average of $61,220, a difference of 1.4%.
Median Male Earnings Correlation Summary
| Measurement | Immigrants from Bulgaria | Immigrants from Scotland |
| Minimum | $4,447 | $20,588 |
| Maximum | $75,897 | $136,042 |
| Range | $71,450 | $115,454 |
| Mean | $60,294 | $62,522 |
| Median | $63,912 | $63,347 |
| Interquartile 25% (IQ1) | $54,049 | $48,304 |
| Interquartile 75% (IQ3) | $69,736 | $70,634 |
| Interquartile Range (IQR) | $15,687 | $22,330 |
| Standard Deviation (Sample) | $15,823 | $20,135 |
| Standard Deviation (Population) | $15,377 | $19,960 |
Demographics Similar to Immigrants from Bulgaria and Immigrants from Scotland by Median Male Earnings
In terms of median male earnings, the demographic groups most similar to Immigrants from Bulgaria are Mongolian ($60,350, a difference of 0.010%), Immigrants from Western Europe ($60,334, a difference of 0.040%), Immigrants from Canada ($60,388, a difference of 0.050%), Immigrants from North America ($60,265, a difference of 0.16%), and Immigrants from Serbia ($60,600, a difference of 0.40%). Similarly, the demographic groups most similar to Immigrants from Scotland are Lithuanian ($61,228, a difference of 0.010%), New Zealander ($61,199, a difference of 0.030%), Greek ($61,242, a difference of 0.040%), Immigrants from Netherlands ($61,096, a difference of 0.20%), and Egyptian ($61,095, a difference of 0.20%).
| Demographics | Rating | Rank | Median Male Earnings |
| South Africans | 99.9 /100 | #53 | Exceptional $61,460 |
| Immigrants | Latvia | 99.9 /100 | #54 | Exceptional $61,422 |
| Greeks | 99.9 /100 | #55 | Exceptional $61,242 |
| Lithuanians | 99.9 /100 | #56 | Exceptional $61,228 |
| Immigrants | Scotland | 99.9 /100 | #57 | Exceptional $61,220 |
| New Zealanders | 99.9 /100 | #58 | Exceptional $61,199 |
| Immigrants | Netherlands | 99.8 /100 | #59 | Exceptional $61,096 |
| Egyptians | 99.8 /100 | #60 | Exceptional $61,095 |
| Bolivians | 99.8 /100 | #61 | Exceptional $61,066 |
| Immigrants | Romania | 99.8 /100 | #62 | Exceptional $61,040 |
| Immigrants | Pakistan | 99.8 /100 | #63 | Exceptional $60,987 |
| Immigrants | Eastern Europe | 99.8 /100 | #64 | Exceptional $60,958 |
| Immigrants | Indonesia | 99.8 /100 | #65 | Exceptional $60,935 |
| Immigrants | Croatia | 99.8 /100 | #66 | Exceptional $60,914 |
| Immigrants | Spain | 99.8 /100 | #67 | Exceptional $60,750 |
| Immigrants | Serbia | 99.7 /100 | #68 | Exceptional $60,600 |
| Immigrants | Canada | 99.7 /100 | #69 | Exceptional $60,388 |
| Immigrants | Bulgaria | 99.7 /100 | #70 | Exceptional $60,358 |
| Mongolians | 99.7 /100 | #71 | Exceptional $60,350 |
| Immigrants | Western Europe | 99.7 /100 | #72 | Exceptional $60,334 |
| Immigrants | North America | 99.7 /100 | #73 | Exceptional $60,265 |