Immigrants from Bolivia vs Immigrants from Austria 4 or more Vehicles in Household
COMPARE
Immigrants from Bolivia
Immigrants from Austria
4 or more Vehicles in Household
4 or more Vehicles in Household Comparison
Immigrants from Bolivia
Immigrants from Austria
6.7%
4 OR MORE VEHICLES IN HOUSEHOLD
92.5/ 100
METRIC RATING
128th/ 347
METRIC RANK
6.0%
4 OR MORE VEHICLES IN HOUSEHOLD
14.3/ 100
METRIC RATING
214th/ 347
METRIC RANK
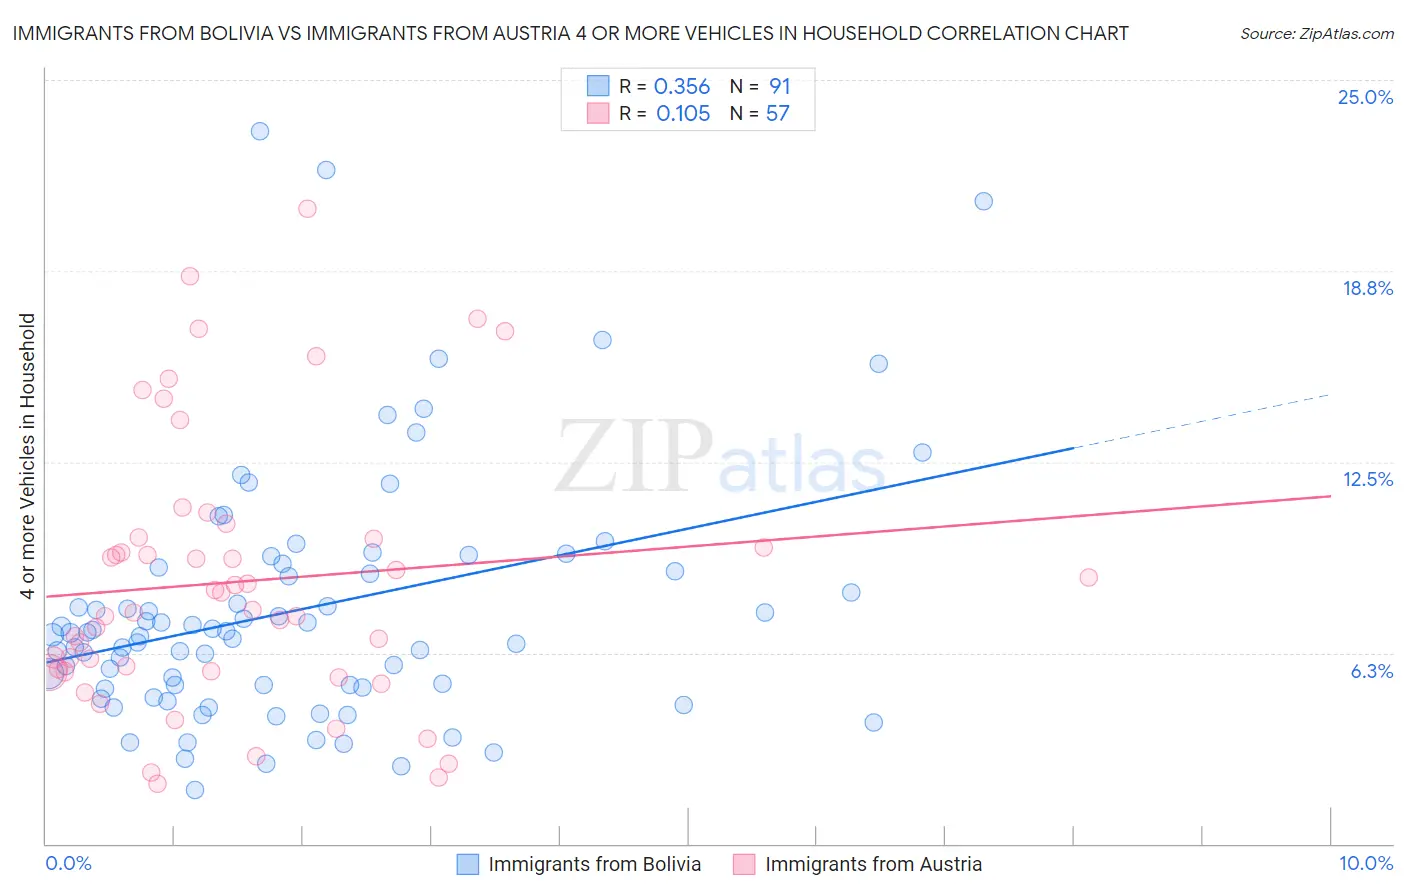
Immigrants from Bolivia vs Immigrants from Austria 4 or more Vehicles in Household Correlation Chart
The statistical analysis conducted on geographies consisting of 158,274,553 people shows a mild positive correlation between the proportion of Immigrants from Bolivia and percentage of households with 4 or more vehicles available in the United States with a correlation coefficient (R) of 0.356 and weighted average of 6.7%. Similarly, the statistical analysis conducted on geographies consisting of 167,408,927 people shows a poor positive correlation between the proportion of Immigrants from Austria and percentage of households with 4 or more vehicles available in the United States with a correlation coefficient (R) of 0.105 and weighted average of 6.0%, a difference of 11.4%.
4 or more Vehicles in Household Correlation Summary
| Measurement | Immigrants from Bolivia | Immigrants from Austria |
| Minimum | 1.8% | 2.0% |
| Maximum | 23.3% | 20.8% |
| Range | 21.6% | 18.8% |
| Mean | 7.7% | 8.6% |
| Median | 6.9% | 7.6% |
| Interquartile 25% (IQ1) | 5.1% | 5.6% |
| Interquartile 75% (IQ3) | 9.0% | 10.0% |
| Interquartile Range (IQR) | 3.9% | 4.4% |
| Standard Deviation (Sample) | 4.1% | 4.4% |
| Standard Deviation (Population) | 4.1% | 4.3% |
Similar Demographics by 4 or more Vehicles in Household
Demographics Similar to Immigrants from Bolivia by 4 or more Vehicles in Household
In terms of 4 or more vehicles in household, the demographic groups most similar to Immigrants from Bolivia are Immigrants from England (6.7%, a difference of 0.16%), Immigrants from Korea (6.8%, a difference of 0.50%), Belgian (6.8%, a difference of 0.62%), Austrian (6.8%, a difference of 0.63%), and Immigrants from Asia (6.8%, a difference of 0.72%).
| Demographics | Rating | Rank | 4 or more Vehicles in Household |
| Immigrants | Germany | 94.7 /100 | #121 | Exceptional 6.8% |
| Immigrants | Nicaragua | 94.7 /100 | #122 | Exceptional 6.8% |
| Immigrants | Immigrants | 94.6 /100 | #123 | Exceptional 6.8% |
| Immigrants | Asia | 94.4 /100 | #124 | Exceptional 6.8% |
| Austrians | 94.1 /100 | #125 | Exceptional 6.8% |
| Belgians | 94.1 /100 | #126 | Exceptional 6.8% |
| Immigrants | Korea | 93.8 /100 | #127 | Exceptional 6.8% |
| Immigrants | Bolivia | 92.5 /100 | #128 | Exceptional 6.7% |
| Immigrants | England | 92.0 /100 | #129 | Exceptional 6.7% |
| Immigrants | Scotland | 89.0 /100 | #130 | Excellent 6.7% |
| Maltese | 88.4 /100 | #131 | Excellent 6.7% |
| Immigrants | Netherlands | 87.8 /100 | #132 | Excellent 6.6% |
| Armenians | 86.9 /100 | #133 | Excellent 6.6% |
| Ottawa | 86.9 /100 | #134 | Excellent 6.6% |
| Tohono O'odham | 86.7 /100 | #135 | Excellent 6.6% |
Demographics Similar to Immigrants from Austria by 4 or more Vehicles in Household
In terms of 4 or more vehicles in household, the demographic groups most similar to Immigrants from Austria are Arab (6.0%, a difference of 0.020%), Immigrants from Egypt (6.0%, a difference of 0.080%), Panamanian (6.0%, a difference of 0.090%), Immigrants from China (6.0%, a difference of 0.11%), and Immigrants from Romania (6.0%, a difference of 0.11%).
| Demographics | Rating | Rank | 4 or more Vehicles in Household |
| Immigrants | Chile | 16.9 /100 | #207 | Poor 6.1% |
| Immigrants | Nigeria | 15.6 /100 | #208 | Poor 6.1% |
| Immigrants | Honduras | 15.4 /100 | #209 | Poor 6.1% |
| Immigrants | Zimbabwe | 15.1 /100 | #210 | Poor 6.0% |
| Panamanians | 14.8 /100 | #211 | Poor 6.0% |
| Immigrants | Egypt | 14.7 /100 | #212 | Poor 6.0% |
| Arabs | 14.4 /100 | #213 | Poor 6.0% |
| Immigrants | Austria | 14.3 /100 | #214 | Poor 6.0% |
| Immigrants | China | 13.8 /100 | #215 | Poor 6.0% |
| Immigrants | Romania | 13.8 /100 | #216 | Poor 6.0% |
| Nigerians | 12.2 /100 | #217 | Poor 6.0% |
| Immigrants | Italy | 11.0 /100 | #218 | Poor 6.0% |
| Serbians | 11.0 /100 | #219 | Poor 6.0% |
| Russians | 10.3 /100 | #220 | Poor 6.0% |
| Immigrants | Moldova | 9.3 /100 | #221 | Tragic 6.0% |