Immigrants from Bolivia vs Immigrants from Costa Rica 4 or more Vehicles in Household
COMPARE
Immigrants from Bolivia
Immigrants from Costa Rica
4 or more Vehicles in Household
4 or more Vehicles in Household Comparison
Immigrants from Bolivia
Immigrants from Costa Rica
6.7%
4 OR MORE VEHICLES IN HOUSEHOLD
92.5/ 100
METRIC RATING
128th/ 347
METRIC RANK
6.5%
4 OR MORE VEHICLES IN HOUSEHOLD
74.4/ 100
METRIC RATING
146th/ 347
METRIC RANK
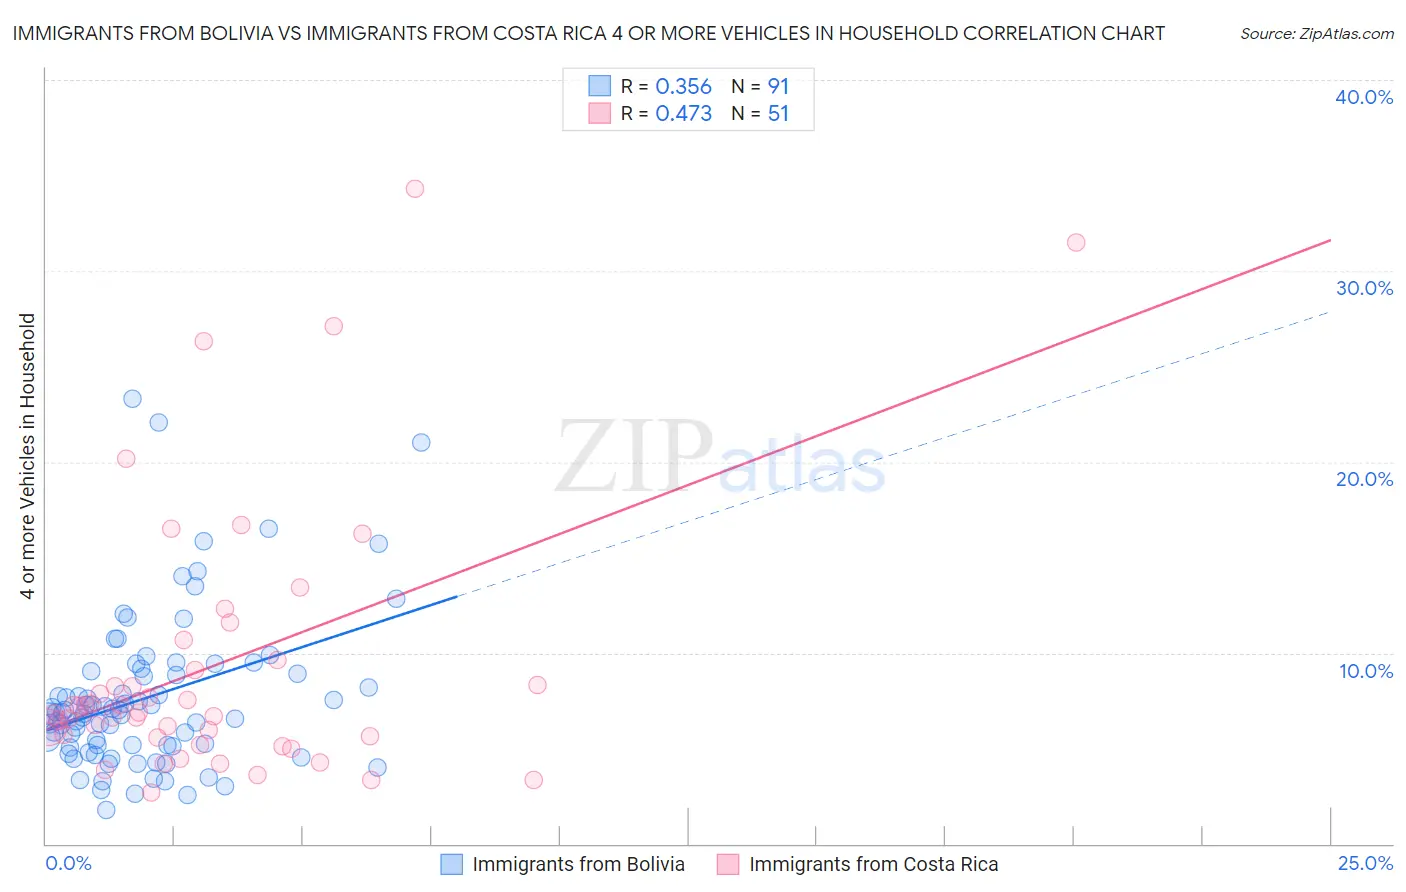
Immigrants from Bolivia vs Immigrants from Costa Rica 4 or more Vehicles in Household Correlation Chart
The statistical analysis conducted on geographies consisting of 158,274,553 people shows a mild positive correlation between the proportion of Immigrants from Bolivia and percentage of households with 4 or more vehicles available in the United States with a correlation coefficient (R) of 0.356 and weighted average of 6.7%. Similarly, the statistical analysis conducted on geographies consisting of 203,475,365 people shows a moderate positive correlation between the proportion of Immigrants from Costa Rica and percentage of households with 4 or more vehicles available in the United States with a correlation coefficient (R) of 0.473 and weighted average of 6.5%, a difference of 3.6%.
4 or more Vehicles in Household Correlation Summary
| Measurement | Immigrants from Bolivia | Immigrants from Costa Rica |
| Minimum | 1.8% | 2.7% |
| Maximum | 23.3% | 34.3% |
| Range | 21.6% | 31.6% |
| Mean | 7.7% | 9.4% |
| Median | 6.9% | 6.9% |
| Interquartile 25% (IQ1) | 5.1% | 5.6% |
| Interquartile 75% (IQ3) | 9.0% | 9.6% |
| Interquartile Range (IQR) | 3.9% | 4.1% |
| Standard Deviation (Sample) | 4.1% | 7.1% |
| Standard Deviation (Population) | 4.1% | 7.0% |
Demographics Similar to Immigrants from Bolivia and Immigrants from Costa Rica by 4 or more Vehicles in Household
In terms of 4 or more vehicles in household, the demographic groups most similar to Immigrants from Bolivia are Immigrants from England (6.7%, a difference of 0.16%), Immigrants from Korea (6.8%, a difference of 0.50%), Immigrants from Scotland (6.7%, a difference of 1.0%), Maltese (6.7%, a difference of 1.1%), and Immigrants from Netherlands (6.6%, a difference of 1.3%). Similarly, the demographic groups most similar to Immigrants from Costa Rica are Immigrants from Iran (6.5%, a difference of 0.050%), Croatian (6.5%, a difference of 0.46%), Immigrants from North America (6.5%, a difference of 0.56%), Immigrants from Canada (6.5%, a difference of 0.58%), and Immigrants from Iraq (6.5%, a difference of 0.71%).
| Demographics | Rating | Rank | 4 or more Vehicles in Household |
| Immigrants | Korea | 93.8 /100 | #127 | Exceptional 6.8% |
| Immigrants | Bolivia | 92.5 /100 | #128 | Exceptional 6.7% |
| Immigrants | England | 92.0 /100 | #129 | Exceptional 6.7% |
| Immigrants | Scotland | 89.0 /100 | #130 | Excellent 6.7% |
| Maltese | 88.4 /100 | #131 | Excellent 6.7% |
| Immigrants | Netherlands | 87.8 /100 | #132 | Excellent 6.6% |
| Armenians | 86.9 /100 | #133 | Excellent 6.6% |
| Ottawa | 86.9 /100 | #134 | Excellent 6.6% |
| Tohono O'odham | 86.7 /100 | #135 | Excellent 6.6% |
| Luxembourgers | 86.4 /100 | #136 | Excellent 6.6% |
| French Canadians | 85.4 /100 | #137 | Excellent 6.6% |
| Italians | 84.5 /100 | #138 | Excellent 6.6% |
| Jordanians | 82.1 /100 | #139 | Excellent 6.6% |
| Slavs | 81.6 /100 | #140 | Excellent 6.6% |
| Australians | 80.8 /100 | #141 | Excellent 6.6% |
| Immigrants | Iraq | 79.4 /100 | #142 | Good 6.5% |
| Immigrants | Canada | 78.6 /100 | #143 | Good 6.5% |
| Immigrants | North America | 78.5 /100 | #144 | Good 6.5% |
| Croatians | 77.8 /100 | #145 | Good 6.5% |
| Immigrants | Costa Rica | 74.4 /100 | #146 | Good 6.5% |
| Immigrants | Iran | 73.9 /100 | #147 | Good 6.5% |