Immigrants from Bolivia vs Immigrants 8th Grade
COMPARE
Immigrants from Bolivia
Immigrants
8th Grade
8th Grade Comparison
Immigrants from Bolivia
Immigrants
94.6%
8TH GRADE
0.1/ 100
METRIC RATING
281st/ 347
METRIC RANK
93.6%
8TH GRADE
0.0/ 100
METRIC RATING
309th/ 347
METRIC RANK
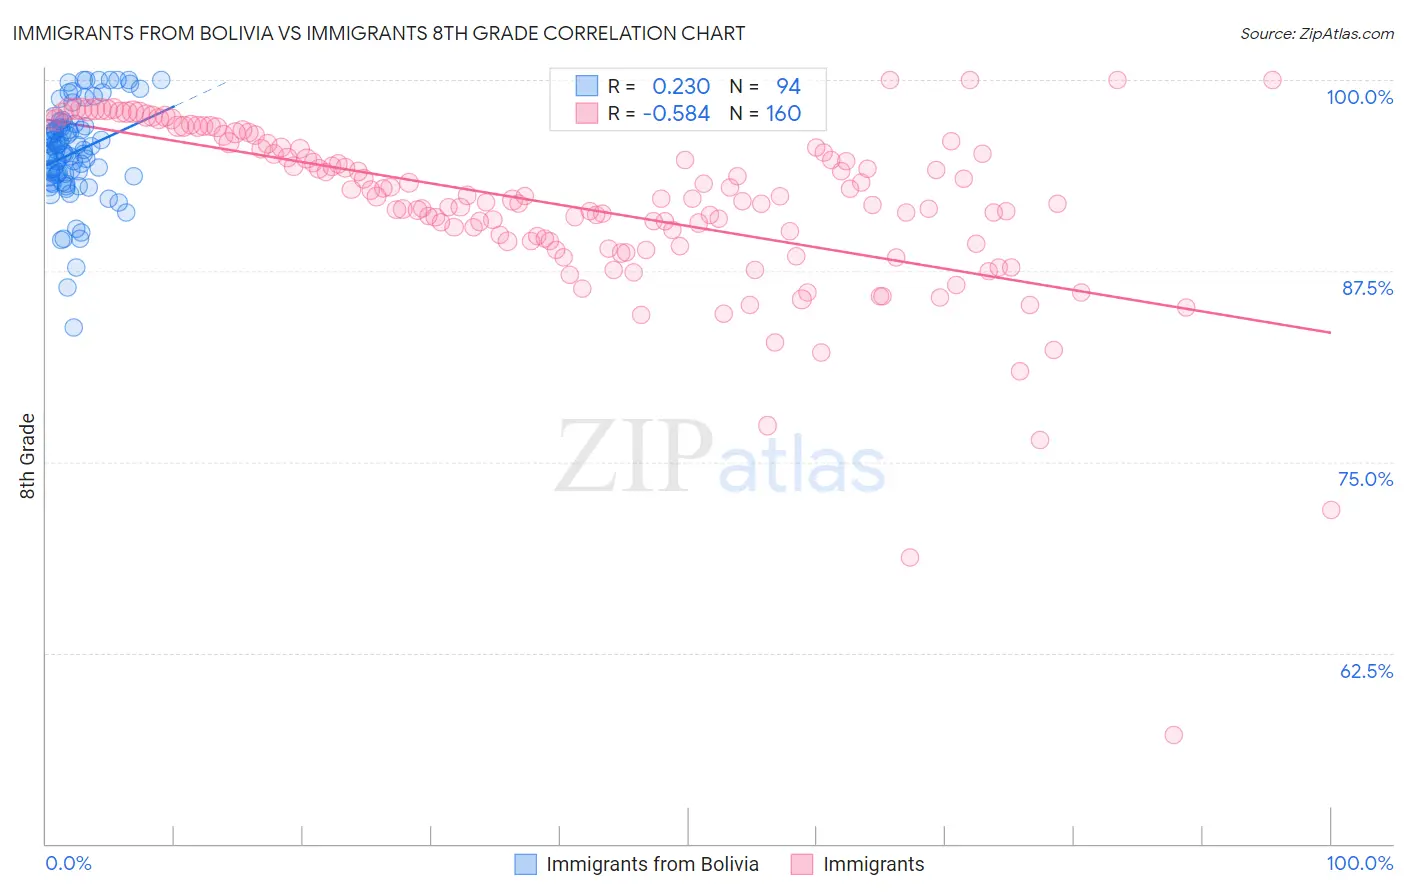
Immigrants from Bolivia vs Immigrants 8th Grade Correlation Chart
The statistical analysis conducted on geographies consisting of 158,727,163 people shows a weak positive correlation between the proportion of Immigrants from Bolivia and percentage of population with at least 8th grade education in the United States with a correlation coefficient (R) of 0.230 and weighted average of 94.6%. Similarly, the statistical analysis conducted on geographies consisting of 577,787,160 people shows a substantial negative correlation between the proportion of Immigrants and percentage of population with at least 8th grade education in the United States with a correlation coefficient (R) of -0.584 and weighted average of 93.6%, a difference of 1.1%.
8th Grade Correlation Summary
| Measurement | Immigrants from Bolivia | Immigrants |
| Minimum | 83.8% | 57.2% |
| Maximum | 100.0% | 100.0% |
| Range | 16.2% | 42.8% |
| Mean | 95.2% | 91.8% |
| Median | 95.3% | 92.2% |
| Interquartile 25% (IQ1) | 93.7% | 89.4% |
| Interquartile 75% (IQ3) | 96.9% | 95.6% |
| Interquartile Range (IQR) | 3.2% | 6.1% |
| Standard Deviation (Sample) | 3.1% | 5.8% |
| Standard Deviation (Population) | 3.1% | 5.8% |
Similar Demographics by 8th Grade
Demographics Similar to Immigrants from Bolivia by 8th Grade
In terms of 8th grade, the demographic groups most similar to Immigrants from Bolivia are Barbadian (94.6%, a difference of 0.0%), Immigrants from Trinidad and Tobago (94.6%, a difference of 0.010%), Armenian (94.7%, a difference of 0.020%), Taiwanese (94.7%, a difference of 0.040%), and Immigrants from Eritrea (94.6%, a difference of 0.040%).
| Demographics | Rating | Rank | 8th Grade |
| Trinidadians and Tobagonians | 0.2 /100 | #274 | Tragic 94.7% |
| Immigrants | Colombia | 0.2 /100 | #275 | Tragic 94.7% |
| Peruvians | 0.1 /100 | #276 | Tragic 94.7% |
| Taiwanese | 0.1 /100 | #277 | Tragic 94.7% |
| Armenians | 0.1 /100 | #278 | Tragic 94.7% |
| Immigrants | Trinidad and Tobago | 0.1 /100 | #279 | Tragic 94.6% |
| Barbadians | 0.1 /100 | #280 | Tragic 94.6% |
| Immigrants | Bolivia | 0.1 /100 | #281 | Tragic 94.6% |
| Immigrants | Eritrea | 0.1 /100 | #282 | Tragic 94.6% |
| Immigrants | St. Vincent and the Grenadines | 0.1 /100 | #283 | Tragic 94.6% |
| Immigrants | Philippines | 0.1 /100 | #284 | Tragic 94.6% |
| Immigrants | Barbados | 0.0 /100 | #285 | Tragic 94.5% |
| Immigrants | Peru | 0.0 /100 | #286 | Tragic 94.5% |
| Tohono O'odham | 0.0 /100 | #287 | Tragic 94.5% |
| Malaysians | 0.0 /100 | #288 | Tragic 94.5% |
Demographics Similar to Immigrants by 8th Grade
In terms of 8th grade, the demographic groups most similar to Immigrants are Japanese (93.6%, a difference of 0.0%), Immigrants from Bangladesh (93.6%, a difference of 0.010%), Ecuadorian (93.6%, a difference of 0.020%), Cape Verdean (93.5%, a difference of 0.050%), and Immigrants from Caribbean (93.5%, a difference of 0.070%).
| Demographics | Rating | Rank | 8th Grade |
| Sri Lankans | 0.0 /100 | #302 | Tragic 94.0% |
| Immigrants | Dominica | 0.0 /100 | #303 | Tragic 94.0% |
| Guyanese | 0.0 /100 | #304 | Tragic 93.9% |
| Immigrants | Haiti | 0.0 /100 | #305 | Tragic 93.9% |
| Immigrants | Guyana | 0.0 /100 | #306 | Tragic 93.8% |
| Immigrants | Portugal | 0.0 /100 | #307 | Tragic 93.8% |
| Ecuadorians | 0.0 /100 | #308 | Tragic 93.6% |
| Immigrants | Immigrants | 0.0 /100 | #309 | Tragic 93.6% |
| Japanese | 0.0 /100 | #310 | Tragic 93.6% |
| Immigrants | Bangladesh | 0.0 /100 | #311 | Tragic 93.6% |
| Cape Verdeans | 0.0 /100 | #312 | Tragic 93.5% |
| Immigrants | Caribbean | 0.0 /100 | #313 | Tragic 93.5% |
| Immigrants | Vietnam | 0.0 /100 | #314 | Tragic 93.5% |
| Vietnamese | 0.0 /100 | #315 | Tragic 93.5% |
| Immigrants | Cambodia | 0.0 /100 | #316 | Tragic 93.3% |