Immigrants from Belarus vs Guatemalan 4 or more Vehicles in Household
COMPARE
Immigrants from Belarus
Guatemalan
4 or more Vehicles in Household
4 or more Vehicles in Household Comparison
Immigrants from Belarus
Guatemalans
4.7%
4 OR MORE VEHICLES IN HOUSEHOLD
0.0/ 100
METRIC RATING
315th/ 347
METRIC RANK
7.0%
4 OR MORE VEHICLES IN HOUSEHOLD
98.1/ 100
METRIC RATING
106th/ 347
METRIC RANK
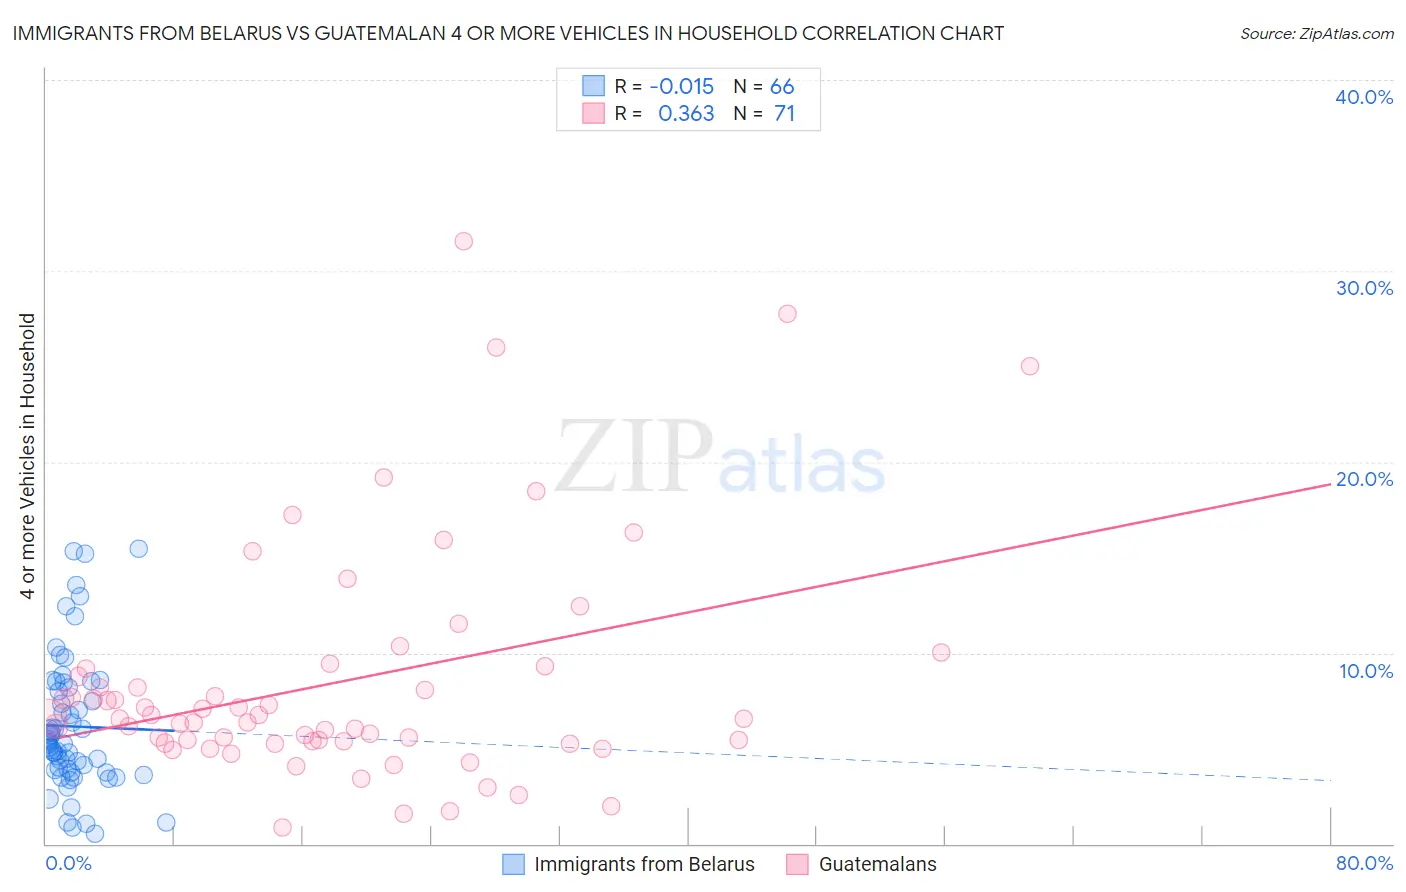
Immigrants from Belarus vs Guatemalan 4 or more Vehicles in Household Correlation Chart
The statistical analysis conducted on geographies consisting of 149,564,029 people shows no correlation between the proportion of Immigrants from Belarus and percentage of households with 4 or more vehicles available in the United States with a correlation coefficient (R) of -0.015 and weighted average of 4.7%. Similarly, the statistical analysis conducted on geographies consisting of 407,811,821 people shows a mild positive correlation between the proportion of Guatemalans and percentage of households with 4 or more vehicles available in the United States with a correlation coefficient (R) of 0.363 and weighted average of 7.0%, a difference of 46.6%.
4 or more Vehicles in Household Correlation Summary
| Measurement | Immigrants from Belarus | Guatemalan |
| Minimum | 0.52% | 0.82% |
| Maximum | 15.4% | 31.6% |
| Range | 14.9% | 30.8% |
| Mean | 6.1% | 8.5% |
| Median | 5.3% | 6.6% |
| Interquartile 25% (IQ1) | 3.9% | 5.4% |
| Interquartile 75% (IQ3) | 8.2% | 9.2% |
| Interquartile Range (IQR) | 4.3% | 3.8% |
| Standard Deviation (Sample) | 3.5% | 6.1% |
| Standard Deviation (Population) | 3.5% | 6.0% |
Similar Demographics by 4 or more Vehicles in Household
Demographics Similar to Immigrants from Belarus by 4 or more Vehicles in Household
In terms of 4 or more vehicles in household, the demographic groups most similar to Immigrants from Belarus are Immigrants from West Indies (4.7%, a difference of 0.090%), Puerto Rican (4.7%, a difference of 0.44%), Immigrants from Israel (4.8%, a difference of 0.88%), Albanian (4.8%, a difference of 0.90%), and U.S. Virgin Islander (4.6%, a difference of 2.1%).
| Demographics | Rating | Rank | 4 or more Vehicles in Household |
| Paraguayans | 0.0 /100 | #308 | Tragic 4.9% |
| Immigrants | Somalia | 0.0 /100 | #309 | Tragic 4.9% |
| Moroccans | 0.0 /100 | #310 | Tragic 4.9% |
| Houma | 0.0 /100 | #311 | Tragic 4.9% |
| Albanians | 0.0 /100 | #312 | Tragic 4.8% |
| Immigrants | Israel | 0.0 /100 | #313 | Tragic 4.8% |
| Immigrants | West Indies | 0.0 /100 | #314 | Tragic 4.7% |
| Immigrants | Belarus | 0.0 /100 | #315 | Tragic 4.7% |
| Puerto Ricans | 0.0 /100 | #316 | Tragic 4.7% |
| U.S. Virgin Islanders | 0.0 /100 | #317 | Tragic 4.6% |
| Jamaicans | 0.0 /100 | #318 | Tragic 4.6% |
| Haitians | 0.0 /100 | #319 | Tragic 4.6% |
| Immigrants | Haiti | 0.0 /100 | #320 | Tragic 4.5% |
| Ecuadorians | 0.0 /100 | #321 | Tragic 4.5% |
| Immigrants | Yemen | 0.0 /100 | #322 | Tragic 4.5% |
Demographics Similar to Guatemalans by 4 or more Vehicles in Household
In terms of 4 or more vehicles in household, the demographic groups most similar to Guatemalans are Nicaraguan (7.0%, a difference of 0.010%), German Russian (7.0%, a difference of 0.34%), Hmong (7.0%, a difference of 0.35%), French (6.9%, a difference of 0.35%), and Filipino (6.9%, a difference of 0.53%).
| Demographics | Rating | Rank | 4 or more Vehicles in Household |
| Seminole | 98.8 /100 | #99 | Exceptional 7.0% |
| Taiwanese | 98.7 /100 | #100 | Exceptional 7.0% |
| Pakistanis | 98.7 /100 | #101 | Exceptional 7.0% |
| Asians | 98.6 /100 | #102 | Exceptional 7.0% |
| Blackfeet | 98.6 /100 | #103 | Exceptional 7.0% |
| Hmong | 98.3 /100 | #104 | Exceptional 7.0% |
| German Russians | 98.3 /100 | #105 | Exceptional 7.0% |
| Guatemalans | 98.1 /100 | #106 | Exceptional 7.0% |
| Nicaraguans | 98.0 /100 | #107 | Exceptional 7.0% |
| French | 97.7 /100 | #108 | Exceptional 6.9% |
| Filipinos | 97.6 /100 | #109 | Exceptional 6.9% |
| Immigrants | Thailand | 97.0 /100 | #110 | Exceptional 6.9% |
| Aleuts | 97.0 /100 | #111 | Exceptional 6.9% |
| Hopi | 97.0 /100 | #112 | Exceptional 6.9% |
| Canadians | 96.4 /100 | #113 | Exceptional 6.9% |