Chickasaw vs Guatemalan 4 or more Vehicles in Household
COMPARE
Chickasaw
Guatemalan
4 or more Vehicles in Household
4 or more Vehicles in Household Comparison
Chickasaw
Guatemalans
7.4%
4 OR MORE VEHICLES IN HOUSEHOLD
99.9/ 100
METRIC RATING
71st/ 347
METRIC RANK
7.0%
4 OR MORE VEHICLES IN HOUSEHOLD
98.1/ 100
METRIC RATING
106th/ 347
METRIC RANK
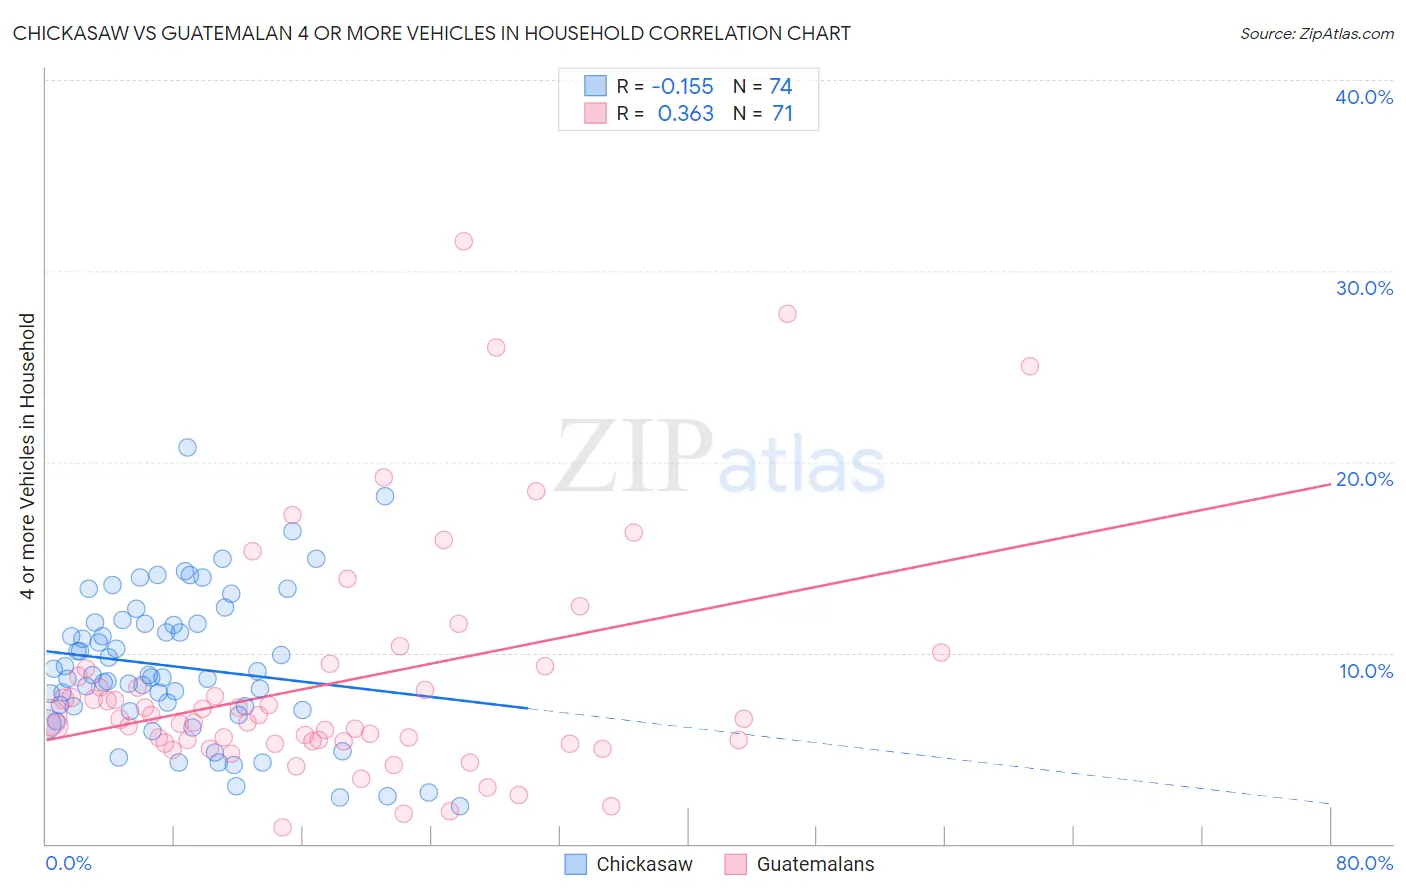
Chickasaw vs Guatemalan 4 or more Vehicles in Household Correlation Chart
The statistical analysis conducted on geographies consisting of 147,524,339 people shows a poor negative correlation between the proportion of Chickasaw and percentage of households with 4 or more vehicles available in the United States with a correlation coefficient (R) of -0.155 and weighted average of 7.4%. Similarly, the statistical analysis conducted on geographies consisting of 407,811,821 people shows a mild positive correlation between the proportion of Guatemalans and percentage of households with 4 or more vehicles available in the United States with a correlation coefficient (R) of 0.363 and weighted average of 7.0%, a difference of 7.0%.
4 or more Vehicles in Household Correlation Summary
| Measurement | Chickasaw | Guatemalan |
| Minimum | 2.0% | 0.82% |
| Maximum | 20.8% | 31.6% |
| Range | 18.8% | 30.8% |
| Mean | 9.3% | 8.5% |
| Median | 8.8% | 6.6% |
| Interquartile 25% (IQ1) | 7.0% | 5.4% |
| Interquartile 75% (IQ3) | 11.5% | 9.2% |
| Interquartile Range (IQR) | 4.5% | 3.8% |
| Standard Deviation (Sample) | 3.8% | 6.1% |
| Standard Deviation (Population) | 3.8% | 6.0% |
Similar Demographics by 4 or more Vehicles in Household
Demographics Similar to Chickasaw by 4 or more Vehicles in Household
In terms of 4 or more vehicles in household, the demographic groups most similar to Chickasaw are Scottish (7.4%, a difference of 0.13%), German (7.5%, a difference of 0.20%), Scotch-Irish (7.4%, a difference of 0.30%), Portuguese (7.4%, a difference of 0.39%), and Icelander (7.4%, a difference of 0.69%).
| Demographics | Rating | Rank | 4 or more Vehicles in Household |
| Bangladeshis | 100.0 /100 | #64 | Exceptional 7.6% |
| Immigrants | Azores | 100.0 /100 | #65 | Exceptional 7.5% |
| Immigrants | Taiwan | 99.9 /100 | #66 | Exceptional 7.5% |
| Americans | 99.9 /100 | #67 | Exceptional 7.5% |
| Welsh | 99.9 /100 | #68 | Exceptional 7.5% |
| Germans | 99.9 /100 | #69 | Exceptional 7.5% |
| Scottish | 99.9 /100 | #70 | Exceptional 7.4% |
| Chickasaw | 99.9 /100 | #71 | Exceptional 7.4% |
| Scotch-Irish | 99.9 /100 | #72 | Exceptional 7.4% |
| Portuguese | 99.9 /100 | #73 | Exceptional 7.4% |
| Icelanders | 99.9 /100 | #74 | Exceptional 7.4% |
| Immigrants | Cambodia | 99.9 /100 | #75 | Exceptional 7.4% |
| Laotians | 99.9 /100 | #76 | Exceptional 7.4% |
| Apache | 99.9 /100 | #77 | Exceptional 7.4% |
| Whites/Caucasians | 99.8 /100 | #78 | Exceptional 7.4% |
Demographics Similar to Guatemalans by 4 or more Vehicles in Household
In terms of 4 or more vehicles in household, the demographic groups most similar to Guatemalans are Nicaraguan (7.0%, a difference of 0.010%), German Russian (7.0%, a difference of 0.34%), Hmong (7.0%, a difference of 0.35%), French (6.9%, a difference of 0.35%), and Filipino (6.9%, a difference of 0.53%).
| Demographics | Rating | Rank | 4 or more Vehicles in Household |
| Seminole | 98.8 /100 | #99 | Exceptional 7.0% |
| Taiwanese | 98.7 /100 | #100 | Exceptional 7.0% |
| Pakistanis | 98.7 /100 | #101 | Exceptional 7.0% |
| Asians | 98.6 /100 | #102 | Exceptional 7.0% |
| Blackfeet | 98.6 /100 | #103 | Exceptional 7.0% |
| Hmong | 98.3 /100 | #104 | Exceptional 7.0% |
| German Russians | 98.3 /100 | #105 | Exceptional 7.0% |
| Guatemalans | 98.1 /100 | #106 | Exceptional 7.0% |
| Nicaraguans | 98.0 /100 | #107 | Exceptional 7.0% |
| French | 97.7 /100 | #108 | Exceptional 6.9% |
| Filipinos | 97.6 /100 | #109 | Exceptional 6.9% |
| Immigrants | Thailand | 97.0 /100 | #110 | Exceptional 6.9% |
| Aleuts | 97.0 /100 | #111 | Exceptional 6.9% |
| Hopi | 97.0 /100 | #112 | Exceptional 6.9% |
| Canadians | 96.4 /100 | #113 | Exceptional 6.9% |