Immigrants from Belgium vs Guatemalan 4 or more Vehicles in Household
COMPARE
Immigrants from Belgium
Guatemalan
4 or more Vehicles in Household
4 or more Vehicles in Household Comparison
Immigrants from Belgium
Guatemalans
5.8%
4 OR MORE VEHICLES IN HOUSEHOLD
4.0/ 100
METRIC RATING
238th/ 347
METRIC RANK
7.0%
4 OR MORE VEHICLES IN HOUSEHOLD
98.1/ 100
METRIC RATING
106th/ 347
METRIC RANK
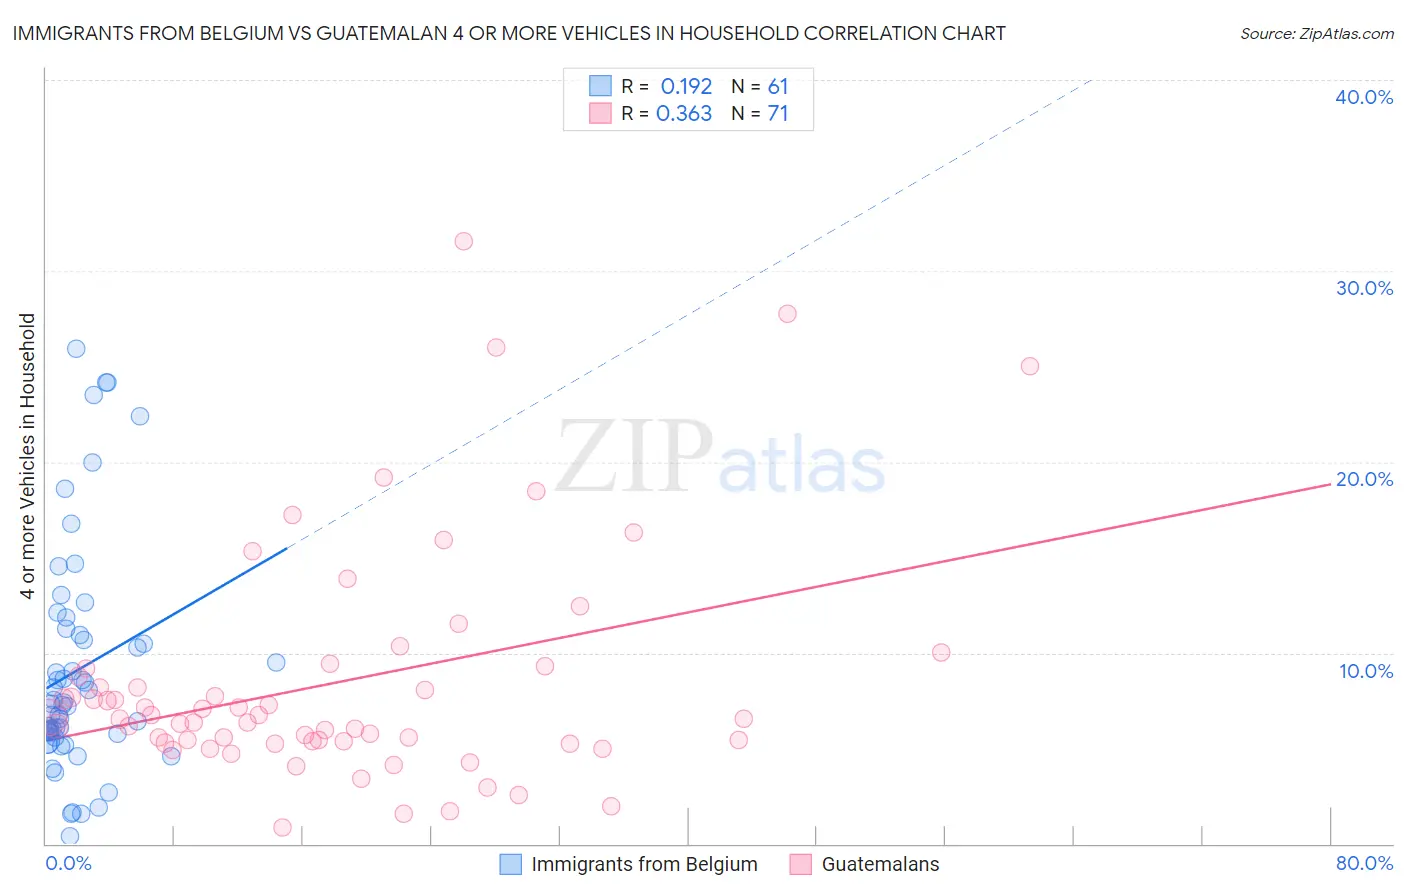
Immigrants from Belgium vs Guatemalan 4 or more Vehicles in Household Correlation Chart
The statistical analysis conducted on geographies consisting of 145,987,799 people shows a poor positive correlation between the proportion of Immigrants from Belgium and percentage of households with 4 or more vehicles available in the United States with a correlation coefficient (R) of 0.192 and weighted average of 5.8%. Similarly, the statistical analysis conducted on geographies consisting of 407,811,821 people shows a mild positive correlation between the proportion of Guatemalans and percentage of households with 4 or more vehicles available in the United States with a correlation coefficient (R) of 0.363 and weighted average of 7.0%, a difference of 19.6%.
4 or more Vehicles in Household Correlation Summary
| Measurement | Immigrants from Belgium | Guatemalan |
| Minimum | 0.41% | 0.82% |
| Maximum | 25.9% | 31.6% |
| Range | 25.5% | 30.8% |
| Mean | 9.1% | 8.5% |
| Median | 7.4% | 6.6% |
| Interquartile 25% (IQ1) | 5.7% | 5.4% |
| Interquartile 75% (IQ3) | 11.1% | 9.2% |
| Interquartile Range (IQR) | 5.4% | 3.8% |
| Standard Deviation (Sample) | 6.0% | 6.1% |
| Standard Deviation (Population) | 5.9% | 6.0% |
Similar Demographics by 4 or more Vehicles in Household
Demographics Similar to Immigrants from Belgium by 4 or more Vehicles in Household
In terms of 4 or more vehicles in household, the demographic groups most similar to Immigrants from Belgium are Immigrants from Australia (5.8%, a difference of 0.090%), Turkish (5.8%, a difference of 0.13%), Immigrants from Poland (5.8%, a difference of 0.13%), Mongolian (5.8%, a difference of 0.23%), and Immigrants from Eritrea (5.8%, a difference of 0.40%).
| Demographics | Rating | Rank | 4 or more Vehicles in Household |
| Immigrants | Switzerland | 6.4 /100 | #231 | Tragic 5.9% |
| Immigrants | Argentina | 6.0 /100 | #232 | Tragic 5.9% |
| Sierra Leoneans | 6.0 /100 | #233 | Tragic 5.9% |
| Africans | 4.6 /100 | #234 | Tragic 5.8% |
| Immigrants | Hungary | 4.6 /100 | #235 | Tragic 5.8% |
| Immigrants | Eritrea | 4.5 /100 | #236 | Tragic 5.8% |
| Turks | 4.1 /100 | #237 | Tragic 5.8% |
| Immigrants | Belgium | 4.0 /100 | #238 | Tragic 5.8% |
| Immigrants | Australia | 3.8 /100 | #239 | Tragic 5.8% |
| Immigrants | Poland | 3.8 /100 | #240 | Tragic 5.8% |
| Mongolians | 3.7 /100 | #241 | Tragic 5.8% |
| Immigrants | Middle Africa | 3.4 /100 | #242 | Tragic 5.8% |
| Immigrants | Czechoslovakia | 3.2 /100 | #243 | Tragic 5.8% |
| Ethiopians | 3.2 /100 | #244 | Tragic 5.8% |
| Bulgarians | 3.1 /100 | #245 | Tragic 5.8% |
Demographics Similar to Guatemalans by 4 or more Vehicles in Household
In terms of 4 or more vehicles in household, the demographic groups most similar to Guatemalans are Nicaraguan (7.0%, a difference of 0.010%), German Russian (7.0%, a difference of 0.34%), Hmong (7.0%, a difference of 0.35%), French (6.9%, a difference of 0.35%), and Filipino (6.9%, a difference of 0.53%).
| Demographics | Rating | Rank | 4 or more Vehicles in Household |
| Seminole | 98.8 /100 | #99 | Exceptional 7.0% |
| Taiwanese | 98.7 /100 | #100 | Exceptional 7.0% |
| Pakistanis | 98.7 /100 | #101 | Exceptional 7.0% |
| Asians | 98.6 /100 | #102 | Exceptional 7.0% |
| Blackfeet | 98.6 /100 | #103 | Exceptional 7.0% |
| Hmong | 98.3 /100 | #104 | Exceptional 7.0% |
| German Russians | 98.3 /100 | #105 | Exceptional 7.0% |
| Guatemalans | 98.1 /100 | #106 | Exceptional 7.0% |
| Nicaraguans | 98.0 /100 | #107 | Exceptional 7.0% |
| French | 97.7 /100 | #108 | Exceptional 6.9% |
| Filipinos | 97.6 /100 | #109 | Exceptional 6.9% |
| Immigrants | Thailand | 97.0 /100 | #110 | Exceptional 6.9% |
| Aleuts | 97.0 /100 | #111 | Exceptional 6.9% |
| Hopi | 97.0 /100 | #112 | Exceptional 6.9% |
| Canadians | 96.4 /100 | #113 | Exceptional 6.9% |