Nigerian vs Guatemalan 4 or more Vehicles in Household
COMPARE
Nigerian
Guatemalan
4 or more Vehicles in Household
4 or more Vehicles in Household Comparison
Nigerians
Guatemalans
6.0%
4 OR MORE VEHICLES IN HOUSEHOLD
12.2/ 100
METRIC RATING
217th/ 347
METRIC RANK
7.0%
4 OR MORE VEHICLES IN HOUSEHOLD
98.1/ 100
METRIC RATING
106th/ 347
METRIC RANK
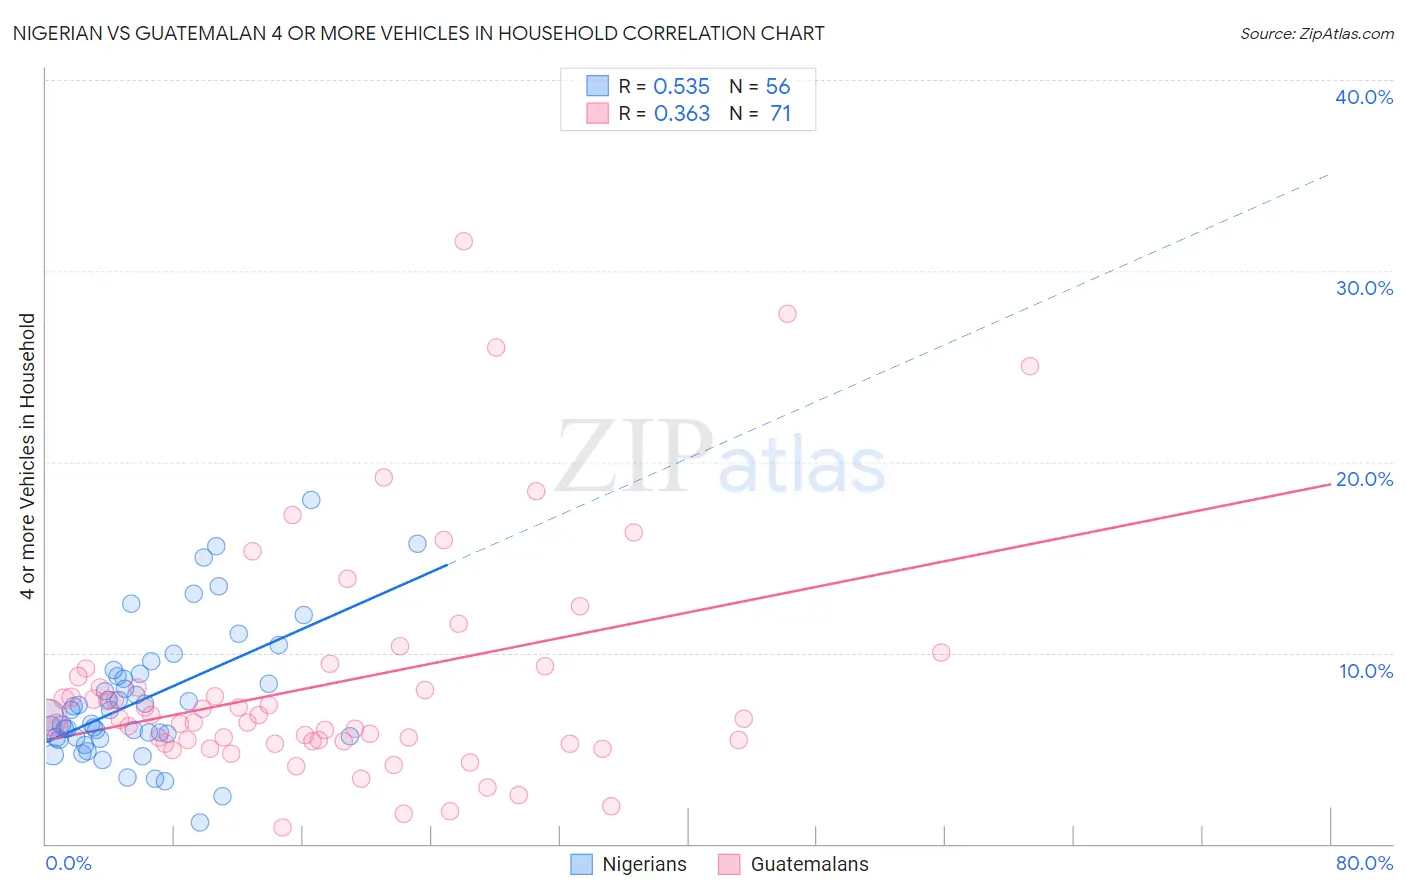
Nigerian vs Guatemalan 4 or more Vehicles in Household Correlation Chart
The statistical analysis conducted on geographies consisting of 331,155,692 people shows a substantial positive correlation between the proportion of Nigerians and percentage of households with 4 or more vehicles available in the United States with a correlation coefficient (R) of 0.535 and weighted average of 6.0%. Similarly, the statistical analysis conducted on geographies consisting of 407,811,821 people shows a mild positive correlation between the proportion of Guatemalans and percentage of households with 4 or more vehicles available in the United States with a correlation coefficient (R) of 0.363 and weighted average of 7.0%, a difference of 15.7%.
4 or more Vehicles in Household Correlation Summary
| Measurement | Nigerian | Guatemalan |
| Minimum | 1.1% | 0.82% |
| Maximum | 18.0% | 31.6% |
| Range | 16.9% | 30.8% |
| Mean | 7.6% | 8.5% |
| Median | 6.9% | 6.6% |
| Interquartile 25% (IQ1) | 5.6% | 5.4% |
| Interquartile 75% (IQ3) | 8.8% | 9.2% |
| Interquartile Range (IQR) | 3.3% | 3.8% |
| Standard Deviation (Sample) | 3.5% | 6.1% |
| Standard Deviation (Population) | 3.4% | 6.0% |
Similar Demographics by 4 or more Vehicles in Household
Demographics Similar to Nigerians by 4 or more Vehicles in Household
In terms of 4 or more vehicles in household, the demographic groups most similar to Nigerians are Immigrants from Italy (6.0%, a difference of 0.31%), Serbian (6.0%, a difference of 0.31%), Immigrants from China (6.0%, a difference of 0.39%), Immigrants from Romania (6.0%, a difference of 0.39%), and Immigrants from Austria (6.0%, a difference of 0.50%).
| Demographics | Rating | Rank | 4 or more Vehicles in Household |
| Immigrants | Zimbabwe | 15.1 /100 | #210 | Poor 6.0% |
| Panamanians | 14.8 /100 | #211 | Poor 6.0% |
| Immigrants | Egypt | 14.7 /100 | #212 | Poor 6.0% |
| Arabs | 14.4 /100 | #213 | Poor 6.0% |
| Immigrants | Austria | 14.3 /100 | #214 | Poor 6.0% |
| Immigrants | China | 13.8 /100 | #215 | Poor 6.0% |
| Immigrants | Romania | 13.8 /100 | #216 | Poor 6.0% |
| Nigerians | 12.2 /100 | #217 | Poor 6.0% |
| Immigrants | Italy | 11.0 /100 | #218 | Poor 6.0% |
| Serbians | 11.0 /100 | #219 | Poor 6.0% |
| Russians | 10.3 /100 | #220 | Poor 6.0% |
| Immigrants | Moldova | 9.3 /100 | #221 | Tragic 6.0% |
| Cajuns | 9.2 /100 | #222 | Tragic 6.0% |
| Immigrants | Kenya | 9.2 /100 | #223 | Tragic 6.0% |
| Cubans | 9.2 /100 | #224 | Tragic 6.0% |
Demographics Similar to Guatemalans by 4 or more Vehicles in Household
In terms of 4 or more vehicles in household, the demographic groups most similar to Guatemalans are Nicaraguan (7.0%, a difference of 0.010%), German Russian (7.0%, a difference of 0.34%), Hmong (7.0%, a difference of 0.35%), French (6.9%, a difference of 0.35%), and Filipino (6.9%, a difference of 0.53%).
| Demographics | Rating | Rank | 4 or more Vehicles in Household |
| Seminole | 98.8 /100 | #99 | Exceptional 7.0% |
| Taiwanese | 98.7 /100 | #100 | Exceptional 7.0% |
| Pakistanis | 98.7 /100 | #101 | Exceptional 7.0% |
| Asians | 98.6 /100 | #102 | Exceptional 7.0% |
| Blackfeet | 98.6 /100 | #103 | Exceptional 7.0% |
| Hmong | 98.3 /100 | #104 | Exceptional 7.0% |
| German Russians | 98.3 /100 | #105 | Exceptional 7.0% |
| Guatemalans | 98.1 /100 | #106 | Exceptional 7.0% |
| Nicaraguans | 98.0 /100 | #107 | Exceptional 7.0% |
| French | 97.7 /100 | #108 | Exceptional 6.9% |
| Filipinos | 97.6 /100 | #109 | Exceptional 6.9% |
| Immigrants | Thailand | 97.0 /100 | #110 | Exceptional 6.9% |
| Aleuts | 97.0 /100 | #111 | Exceptional 6.9% |
| Hopi | 97.0 /100 | #112 | Exceptional 6.9% |
| Canadians | 96.4 /100 | #113 | Exceptional 6.9% |