Immigrants from Belarus vs Immigrants from Spain 4 or more Vehicles in Household
COMPARE
Immigrants from Belarus
Immigrants from Spain
4 or more Vehicles in Household
4 or more Vehicles in Household Comparison
Immigrants from Belarus
Immigrants from Spain
4.7%
4 OR MORE VEHICLES IN HOUSEHOLD
0.0/ 100
METRIC RATING
315th/ 347
METRIC RANK
5.4%
4 OR MORE VEHICLES IN HOUSEHOLD
0.3/ 100
METRIC RATING
282nd/ 347
METRIC RANK
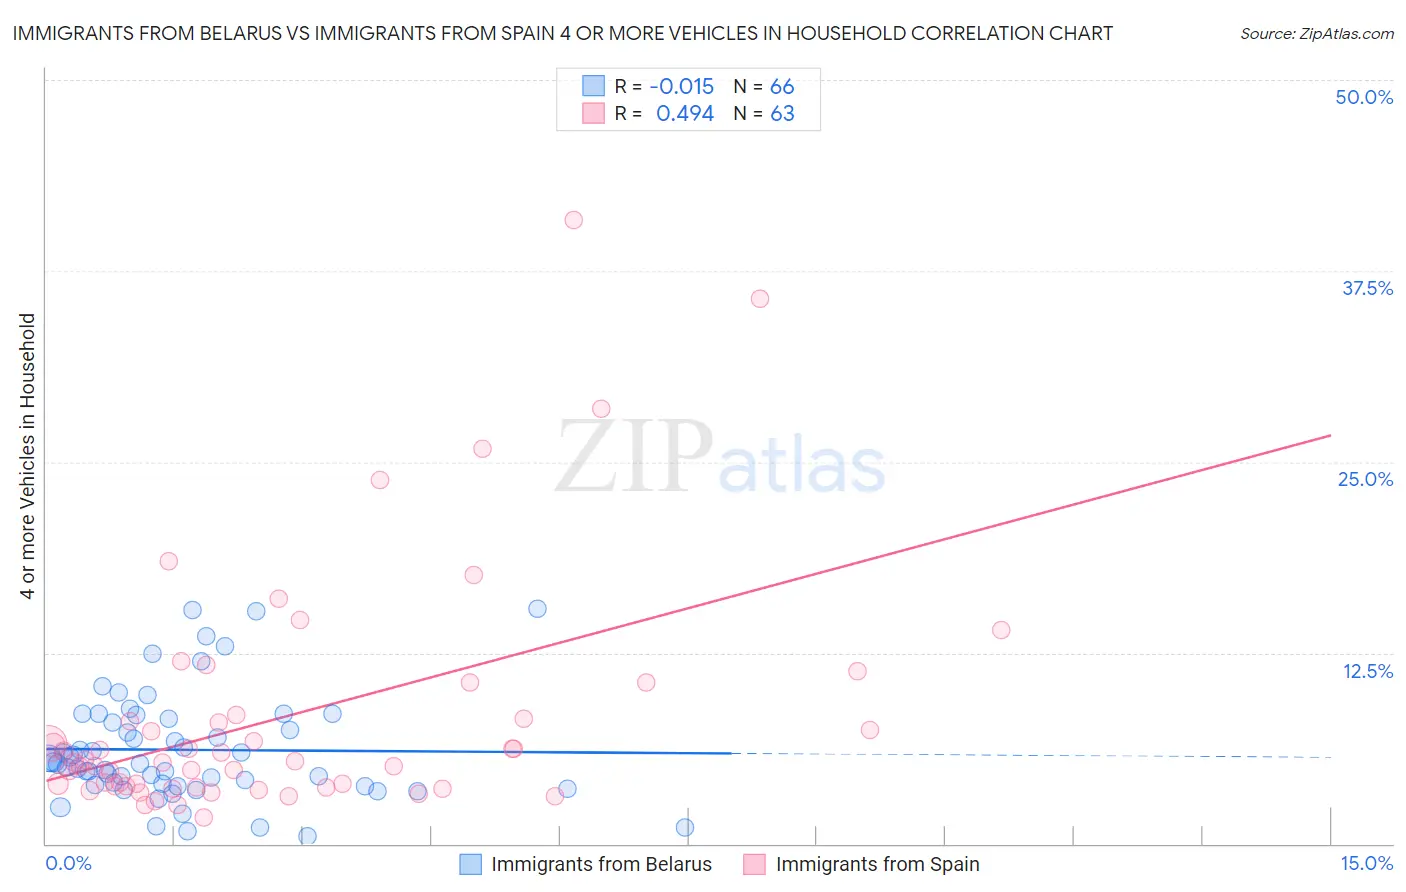
Immigrants from Belarus vs Immigrants from Spain 4 or more Vehicles in Household Correlation Chart
The statistical analysis conducted on geographies consisting of 149,564,029 people shows no correlation between the proportion of Immigrants from Belarus and percentage of households with 4 or more vehicles available in the United States with a correlation coefficient (R) of -0.015 and weighted average of 4.7%. Similarly, the statistical analysis conducted on geographies consisting of 238,415,926 people shows a moderate positive correlation between the proportion of Immigrants from Spain and percentage of households with 4 or more vehicles available in the United States with a correlation coefficient (R) of 0.494 and weighted average of 5.4%, a difference of 13.8%.
4 or more Vehicles in Household Correlation Summary
| Measurement | Immigrants from Belarus | Immigrants from Spain |
| Minimum | 0.52% | 1.7% |
| Maximum | 15.4% | 40.8% |
| Range | 14.9% | 39.1% |
| Mean | 6.1% | 8.4% |
| Median | 5.3% | 5.4% |
| Interquartile 25% (IQ1) | 3.9% | 3.7% |
| Interquartile 75% (IQ3) | 8.2% | 8.4% |
| Interquartile Range (IQR) | 4.3% | 4.7% |
| Standard Deviation (Sample) | 3.5% | 7.8% |
| Standard Deviation (Population) | 3.5% | 7.8% |
Similar Demographics by 4 or more Vehicles in Household
Demographics Similar to Immigrants from Belarus by 4 or more Vehicles in Household
In terms of 4 or more vehicles in household, the demographic groups most similar to Immigrants from Belarus are Immigrants from West Indies (4.7%, a difference of 0.090%), Puerto Rican (4.7%, a difference of 0.44%), Immigrants from Israel (4.8%, a difference of 0.88%), Albanian (4.8%, a difference of 0.90%), and U.S. Virgin Islander (4.6%, a difference of 2.1%).
| Demographics | Rating | Rank | 4 or more Vehicles in Household |
| Paraguayans | 0.0 /100 | #308 | Tragic 4.9% |
| Immigrants | Somalia | 0.0 /100 | #309 | Tragic 4.9% |
| Moroccans | 0.0 /100 | #310 | Tragic 4.9% |
| Houma | 0.0 /100 | #311 | Tragic 4.9% |
| Albanians | 0.0 /100 | #312 | Tragic 4.8% |
| Immigrants | Israel | 0.0 /100 | #313 | Tragic 4.8% |
| Immigrants | West Indies | 0.0 /100 | #314 | Tragic 4.7% |
| Immigrants | Belarus | 0.0 /100 | #315 | Tragic 4.7% |
| Puerto Ricans | 0.0 /100 | #316 | Tragic 4.7% |
| U.S. Virgin Islanders | 0.0 /100 | #317 | Tragic 4.6% |
| Jamaicans | 0.0 /100 | #318 | Tragic 4.6% |
| Haitians | 0.0 /100 | #319 | Tragic 4.6% |
| Immigrants | Haiti | 0.0 /100 | #320 | Tragic 4.5% |
| Ecuadorians | 0.0 /100 | #321 | Tragic 4.5% |
| Immigrants | Yemen | 0.0 /100 | #322 | Tragic 4.5% |
Demographics Similar to Immigrants from Spain by 4 or more Vehicles in Household
In terms of 4 or more vehicles in household, the demographic groups most similar to Immigrants from Spain are Immigrants from Ireland (5.4%, a difference of 0.080%), Immigrants from Western Africa (5.4%, a difference of 0.17%), Alsatian (5.4%, a difference of 0.24%), Immigrants from Uruguay (5.4%, a difference of 0.25%), and Brazilian (5.4%, a difference of 0.37%).
| Demographics | Rating | Rank | 4 or more Vehicles in Household |
| Cambodians | 0.5 /100 | #275 | Tragic 5.5% |
| Immigrants | Latvia | 0.5 /100 | #276 | Tragic 5.5% |
| Immigrants | Bulgaria | 0.5 /100 | #277 | Tragic 5.5% |
| Immigrants | Eastern Europe | 0.4 /100 | #278 | Tragic 5.4% |
| Immigrants | Uruguay | 0.3 /100 | #279 | Tragic 5.4% |
| Alsatians | 0.3 /100 | #280 | Tragic 5.4% |
| Immigrants | Western Africa | 0.3 /100 | #281 | Tragic 5.4% |
| Immigrants | Spain | 0.3 /100 | #282 | Tragic 5.4% |
| Immigrants | Ireland | 0.3 /100 | #283 | Tragic 5.4% |
| Brazilians | 0.3 /100 | #284 | Tragic 5.4% |
| Immigrants | Liberia | 0.2 /100 | #285 | Tragic 5.4% |
| Immigrants | Colombia | 0.2 /100 | #286 | Tragic 5.4% |
| Immigrants | Croatia | 0.2 /100 | #287 | Tragic 5.4% |
| Venezuelans | 0.2 /100 | #288 | Tragic 5.3% |
| Immigrants | Bosnia and Herzegovina | 0.2 /100 | #289 | Tragic 5.3% |