Immigrants from Belarus vs Nepalese 4 or more Vehicles in Household
COMPARE
Immigrants from Belarus
Nepalese
4 or more Vehicles in Household
4 or more Vehicles in Household Comparison
Immigrants from Belarus
Nepalese
4.7%
4 OR MORE VEHICLES IN HOUSEHOLD
0.0/ 100
METRIC RATING
315th/ 347
METRIC RANK
8.7%
4 OR MORE VEHICLES IN HOUSEHOLD
100.0/ 100
METRIC RATING
18th/ 347
METRIC RANK
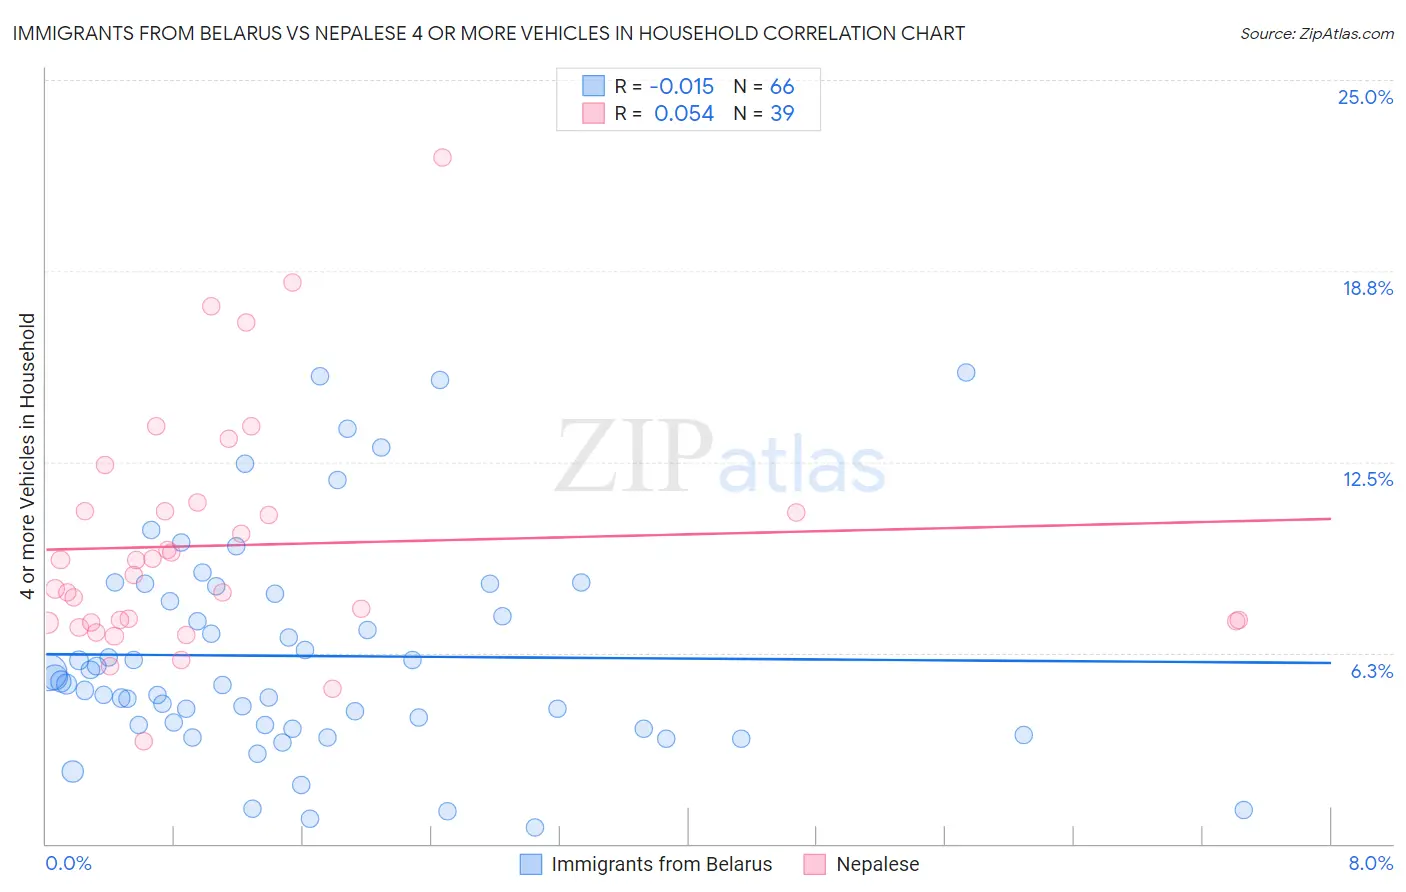
Immigrants from Belarus vs Nepalese 4 or more Vehicles in Household Correlation Chart
The statistical analysis conducted on geographies consisting of 149,564,029 people shows no correlation between the proportion of Immigrants from Belarus and percentage of households with 4 or more vehicles available in the United States with a correlation coefficient (R) of -0.015 and weighted average of 4.7%. Similarly, the statistical analysis conducted on geographies consisting of 24,517,800 people shows a slight positive correlation between the proportion of Nepalese and percentage of households with 4 or more vehicles available in the United States with a correlation coefficient (R) of 0.054 and weighted average of 8.7%, a difference of 84.4%.
4 or more Vehicles in Household Correlation Summary
| Measurement | Immigrants from Belarus | Nepalese |
| Minimum | 0.52% | 3.4% |
| Maximum | 15.4% | 22.4% |
| Range | 14.9% | 19.1% |
| Mean | 6.1% | 9.8% |
| Median | 5.3% | 8.8% |
| Interquartile 25% (IQ1) | 3.9% | 7.2% |
| Interquartile 75% (IQ3) | 8.2% | 10.9% |
| Interquartile Range (IQR) | 4.3% | 3.7% |
| Standard Deviation (Sample) | 3.5% | 3.9% |
| Standard Deviation (Population) | 3.5% | 3.9% |
Similar Demographics by 4 or more Vehicles in Household
Demographics Similar to Immigrants from Belarus by 4 or more Vehicles in Household
In terms of 4 or more vehicles in household, the demographic groups most similar to Immigrants from Belarus are Immigrants from West Indies (4.7%, a difference of 0.090%), Puerto Rican (4.7%, a difference of 0.44%), Immigrants from Israel (4.8%, a difference of 0.88%), Albanian (4.8%, a difference of 0.90%), and U.S. Virgin Islander (4.6%, a difference of 2.1%).
| Demographics | Rating | Rank | 4 or more Vehicles in Household |
| Paraguayans | 0.0 /100 | #308 | Tragic 4.9% |
| Immigrants | Somalia | 0.0 /100 | #309 | Tragic 4.9% |
| Moroccans | 0.0 /100 | #310 | Tragic 4.9% |
| Houma | 0.0 /100 | #311 | Tragic 4.9% |
| Albanians | 0.0 /100 | #312 | Tragic 4.8% |
| Immigrants | Israel | 0.0 /100 | #313 | Tragic 4.8% |
| Immigrants | West Indies | 0.0 /100 | #314 | Tragic 4.7% |
| Immigrants | Belarus | 0.0 /100 | #315 | Tragic 4.7% |
| Puerto Ricans | 0.0 /100 | #316 | Tragic 4.7% |
| U.S. Virgin Islanders | 0.0 /100 | #317 | Tragic 4.6% |
| Jamaicans | 0.0 /100 | #318 | Tragic 4.6% |
| Haitians | 0.0 /100 | #319 | Tragic 4.6% |
| Immigrants | Haiti | 0.0 /100 | #320 | Tragic 4.5% |
| Ecuadorians | 0.0 /100 | #321 | Tragic 4.5% |
| Immigrants | Yemen | 0.0 /100 | #322 | Tragic 4.5% |
Demographics Similar to Nepalese by 4 or more Vehicles in Household
In terms of 4 or more vehicles in household, the demographic groups most similar to Nepalese are Ute (8.8%, a difference of 0.10%), Lumbee (8.8%, a difference of 0.43%), Shoshone (8.8%, a difference of 1.1%), Korean (8.6%, a difference of 1.1%), and Chinese (8.8%, a difference of 1.2%).
| Demographics | Rating | Rank | 4 or more Vehicles in Household |
| Immigrants | Mexico | 100.0 /100 | #11 | Exceptional 9.0% |
| Mexicans | 100.0 /100 | #12 | Exceptional 8.9% |
| Hawaiians | 100.0 /100 | #13 | Exceptional 8.9% |
| Chinese | 100.0 /100 | #14 | Exceptional 8.8% |
| Shoshone | 100.0 /100 | #15 | Exceptional 8.8% |
| Lumbee | 100.0 /100 | #16 | Exceptional 8.8% |
| Ute | 100.0 /100 | #17 | Exceptional 8.8% |
| Nepalese | 100.0 /100 | #18 | Exceptional 8.7% |
| Koreans | 100.0 /100 | #19 | Exceptional 8.6% |
| Pueblo | 100.0 /100 | #20 | Exceptional 8.6% |
| Danes | 100.0 /100 | #21 | Exceptional 8.6% |
| Immigrants | Vietnam | 100.0 /100 | #22 | Exceptional 8.6% |
| Immigrants | Philippines | 100.0 /100 | #23 | Exceptional 8.5% |
| Immigrants | Central America | 100.0 /100 | #24 | Exceptional 8.5% |
| Basques | 100.0 /100 | #25 | Exceptional 8.4% |