Immigrants from Belarus vs Guatemalan Single Mother Poverty
COMPARE
Immigrants from Belarus
Guatemalan
Single Mother Poverty
Single Mother Poverty Comparison
Immigrants from Belarus
Guatemalans
27.4%
SINGLE MOTHER POVERTY
99.4/ 100
METRIC RATING
70th/ 347
METRIC RANK
32.9%
SINGLE MOTHER POVERTY
0.0/ 100
METRIC RATING
291st/ 347
METRIC RANK
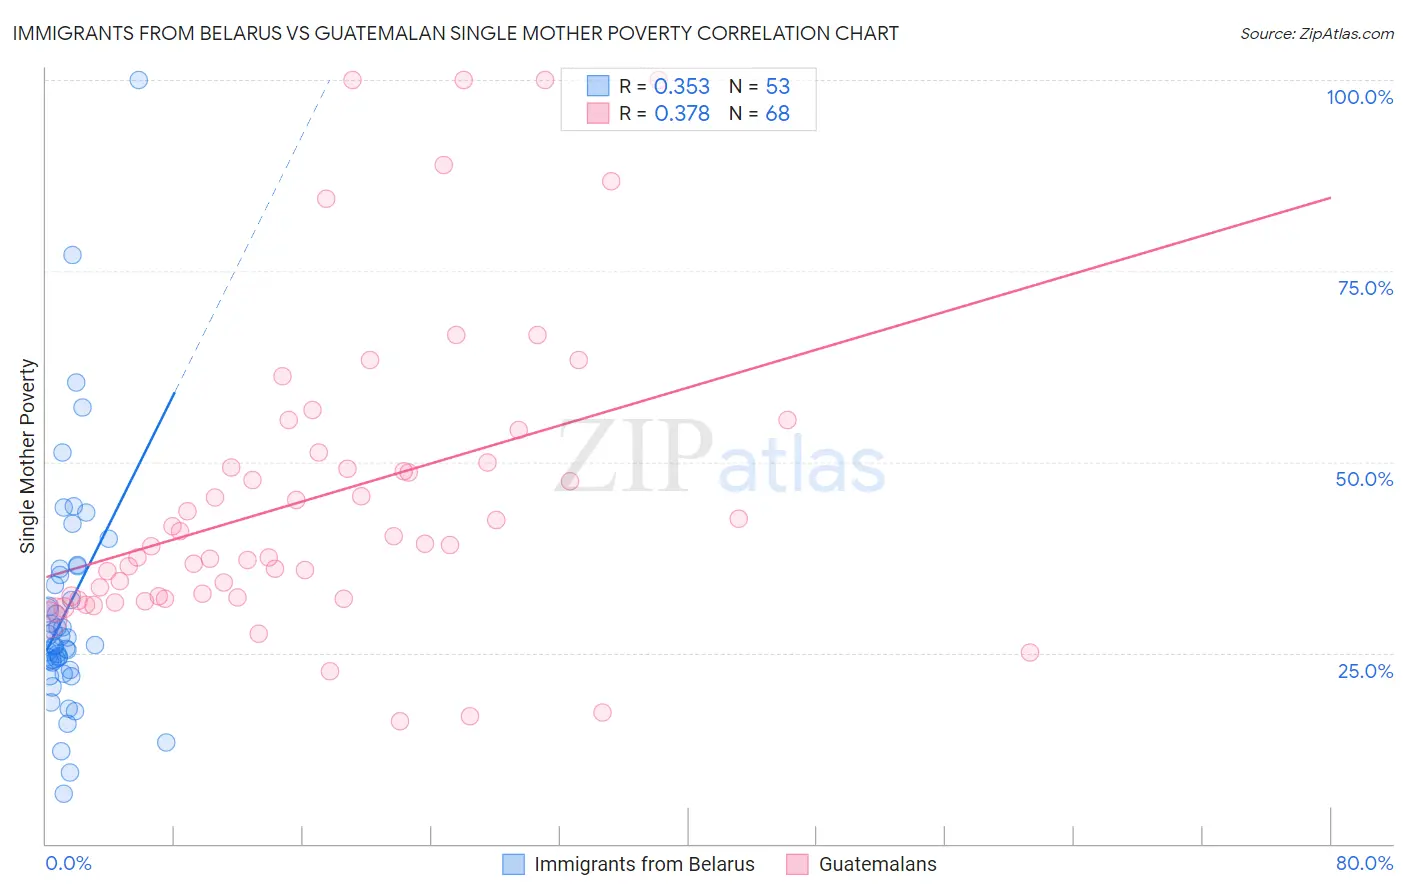
Immigrants from Belarus vs Guatemalan Single Mother Poverty Correlation Chart
The statistical analysis conducted on geographies consisting of 148,206,459 people shows a mild positive correlation between the proportion of Immigrants from Belarus and poverty level among single mothers in the United States with a correlation coefficient (R) of 0.353 and weighted average of 27.4%. Similarly, the statistical analysis conducted on geographies consisting of 401,916,262 people shows a mild positive correlation between the proportion of Guatemalans and poverty level among single mothers in the United States with a correlation coefficient (R) of 0.378 and weighted average of 32.9%, a difference of 20.1%.
Single Mother Poverty Correlation Summary
| Measurement | Immigrants from Belarus | Guatemalan |
| Minimum | 6.6% | 16.0% |
| Maximum | 100.0% | 100.0% |
| Range | 93.4% | 84.0% |
| Mean | 30.6% | 45.6% |
| Median | 26.1% | 39.2% |
| Interquartile 25% (IQ1) | 23.2% | 32.3% |
| Interquartile 75% (IQ3) | 35.6% | 50.6% |
| Interquartile Range (IQR) | 12.4% | 18.3% |
| Standard Deviation (Sample) | 15.9% | 20.1% |
| Standard Deviation (Population) | 15.8% | 19.9% |
Similar Demographics by Single Mother Poverty
Demographics Similar to Immigrants from Belarus by Single Mother Poverty
In terms of single mother poverty, the demographic groups most similar to Immigrants from Belarus are Lithuanian (27.4%, a difference of 0.010%), Macedonian (27.4%, a difference of 0.020%), Immigrants from Russia (27.4%, a difference of 0.040%), Sierra Leonean (27.4%, a difference of 0.11%), and Immigrants from Czechoslovakia (27.4%, a difference of 0.17%).
| Demographics | Rating | Rank | Single Mother Poverty |
| Immigrants | Northern Europe | 99.5 /100 | #63 | Exceptional 27.3% |
| Russians | 99.5 /100 | #64 | Exceptional 27.3% |
| Immigrants | Turkey | 99.5 /100 | #65 | Exceptional 27.3% |
| Soviet Union | 99.5 /100 | #66 | Exceptional 27.3% |
| Immigrants | Australia | 99.5 /100 | #67 | Exceptional 27.3% |
| Immigrants | Czechoslovakia | 99.5 /100 | #68 | Exceptional 27.4% |
| Lithuanians | 99.4 /100 | #69 | Exceptional 27.4% |
| Immigrants | Belarus | 99.4 /100 | #70 | Exceptional 27.4% |
| Macedonians | 99.4 /100 | #71 | Exceptional 27.4% |
| Immigrants | Russia | 99.4 /100 | #72 | Exceptional 27.4% |
| Sierra Leoneans | 99.3 /100 | #73 | Exceptional 27.4% |
| Immigrants | Europe | 99.3 /100 | #74 | Exceptional 27.4% |
| Immigrants | Sweden | 99.2 /100 | #75 | Exceptional 27.5% |
| Peruvians | 99.2 /100 | #76 | Exceptional 27.5% |
| Immigrants | Peru | 99.2 /100 | #77 | Exceptional 27.5% |
Demographics Similar to Guatemalans by Single Mother Poverty
In terms of single mother poverty, the demographic groups most similar to Guatemalans are Shoshone (32.9%, a difference of 0.020%), Aleut (32.9%, a difference of 0.050%), French American Indian (33.1%, a difference of 0.68%), Yaqui (33.1%, a difference of 0.72%), and Blackfeet (33.2%, a difference of 0.88%).
| Demographics | Rating | Rank | Single Mother Poverty |
| Indonesians | 0.0 /100 | #284 | Tragic 32.4% |
| Immigrants | Latin America | 0.0 /100 | #285 | Tragic 32.4% |
| Yup'ik | 0.0 /100 | #286 | Tragic 32.5% |
| Immigrants | Dominica | 0.0 /100 | #287 | Tragic 32.5% |
| Somalis | 0.0 /100 | #288 | Tragic 32.6% |
| U.S. Virgin Islanders | 0.0 /100 | #289 | Tragic 32.6% |
| Osage | 0.0 /100 | #290 | Tragic 32.6% |
| Guatemalans | 0.0 /100 | #291 | Tragic 32.9% |
| Shoshone | 0.0 /100 | #292 | Tragic 32.9% |
| Aleuts | 0.0 /100 | #293 | Tragic 32.9% |
| French American Indians | 0.0 /100 | #294 | Tragic 33.1% |
| Yaqui | 0.0 /100 | #295 | Tragic 33.1% |
| Blackfeet | 0.0 /100 | #296 | Tragic 33.2% |
| Pennsylvania Germans | 0.0 /100 | #297 | Tragic 33.2% |
| Africans | 0.0 /100 | #298 | Tragic 33.3% |