Immigrants from Belarus vs Guatemalan Unemployment
COMPARE
Immigrants from Belarus
Guatemalan
Unemployment
Unemployment Comparison
Immigrants from Belarus
Guatemalans
5.3%
UNEMPLOYMENT
35.6/ 100
METRIC RATING
189th/ 347
METRIC RANK
5.8%
UNEMPLOYMENT
0.2/ 100
METRIC RATING
256th/ 347
METRIC RANK
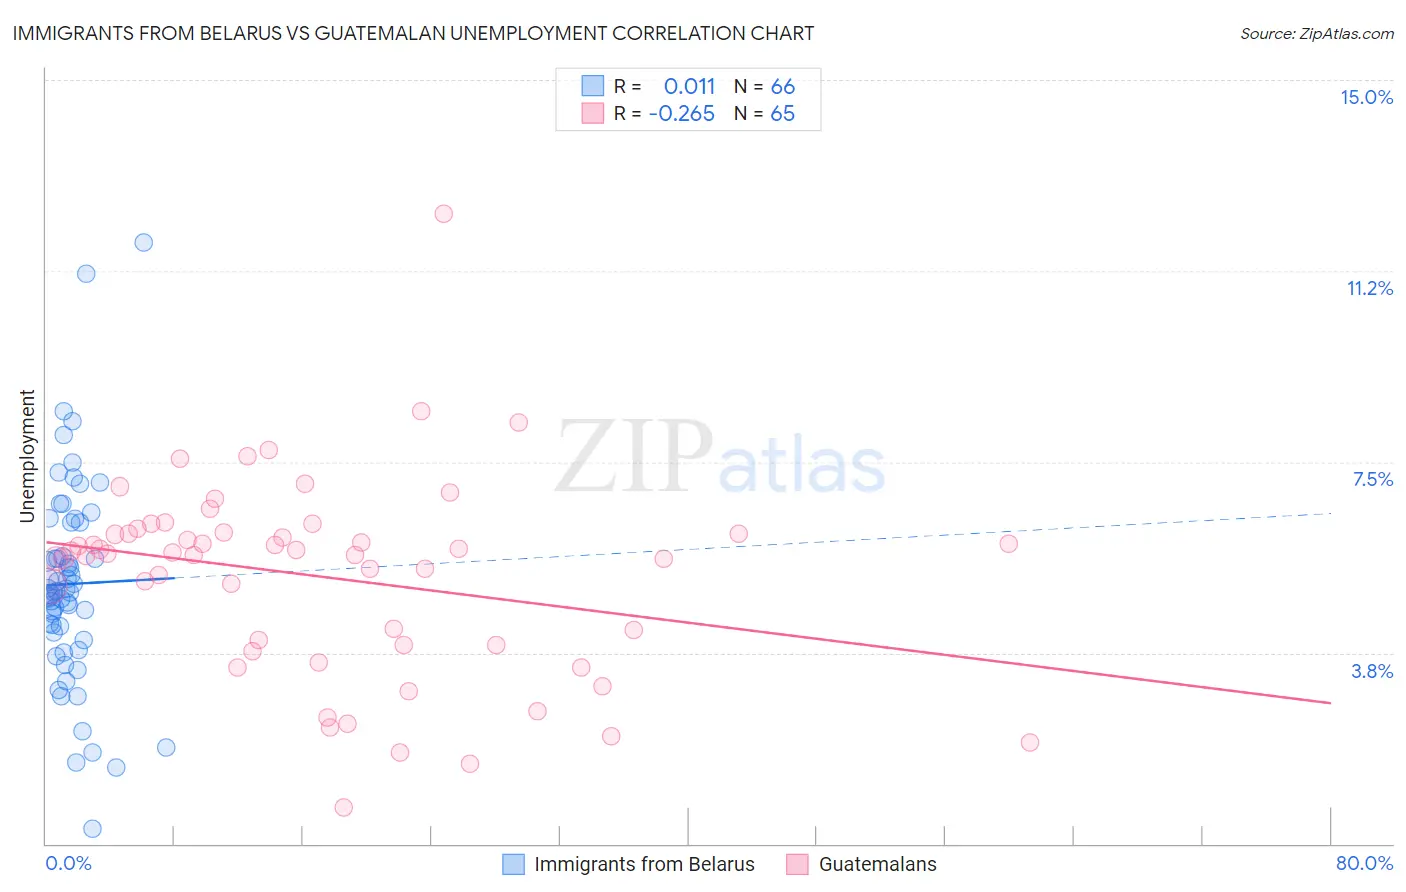
Immigrants from Belarus vs Guatemalan Unemployment Correlation Chart
The statistical analysis conducted on geographies consisting of 150,154,457 people shows no correlation between the proportion of Immigrants from Belarus and unemployment in the United States with a correlation coefficient (R) of 0.011 and weighted average of 5.3%. Similarly, the statistical analysis conducted on geographies consisting of 409,136,964 people shows a weak negative correlation between the proportion of Guatemalans and unemployment in the United States with a correlation coefficient (R) of -0.265 and weighted average of 5.8%, a difference of 8.6%.
Unemployment Correlation Summary
| Measurement | Immigrants from Belarus | Guatemalan |
| Minimum | 0.30% | 0.70% |
| Maximum | 11.8% | 12.4% |
| Range | 11.5% | 11.7% |
| Mean | 5.1% | 5.2% |
| Median | 4.9% | 5.7% |
| Interquartile 25% (IQ1) | 4.2% | 3.9% |
| Interquartile 75% (IQ3) | 6.3% | 6.1% |
| Interquartile Range (IQR) | 2.1% | 2.2% |
| Standard Deviation (Sample) | 2.0% | 1.9% |
| Standard Deviation (Population) | 2.0% | 1.9% |
Similar Demographics by Unemployment
Demographics Similar to Immigrants from Belarus by Unemployment
In terms of unemployment, the demographic groups most similar to Immigrants from Belarus are Arab (5.3%, a difference of 0.020%), Alsatian (5.3%, a difference of 0.090%), Somali (5.3%, a difference of 0.11%), South American (5.3%, a difference of 0.11%), and Costa Rican (5.3%, a difference of 0.12%).
| Demographics | Rating | Rank | Unemployment |
| Spaniards | 42.2 /100 | #182 | Average 5.3% |
| Brazilians | 40.2 /100 | #183 | Average 5.3% |
| Assyrians/Chaldeans/Syriacs | 39.2 /100 | #184 | Fair 5.3% |
| Immigrants | Thailand | 38.9 /100 | #185 | Fair 5.3% |
| Immigrants | Uganda | 37.8 /100 | #186 | Fair 5.3% |
| Costa Ricans | 37.4 /100 | #187 | Fair 5.3% |
| Alsatians | 37.0 /100 | #188 | Fair 5.3% |
| Immigrants | Belarus | 35.6 /100 | #189 | Fair 5.3% |
| Arabs | 35.3 /100 | #190 | Fair 5.3% |
| Somalis | 34.0 /100 | #191 | Fair 5.3% |
| South Americans | 33.9 /100 | #192 | Fair 5.3% |
| Immigrants | Somalia | 33.8 /100 | #193 | Fair 5.3% |
| Immigrants | Laos | 30.9 /100 | #194 | Fair 5.3% |
| Immigrants | Southern Europe | 30.9 /100 | #195 | Fair 5.3% |
| Peruvians | 29.9 /100 | #196 | Fair 5.3% |
Demographics Similar to Guatemalans by Unemployment
In terms of unemployment, the demographic groups most similar to Guatemalans are Immigrants from Portugal (5.7%, a difference of 0.21%), Yaqui (5.8%, a difference of 0.30%), Immigrants from Bahamas (5.8%, a difference of 0.44%), Subsaharan African (5.8%, a difference of 0.56%), and Immigrants from Uzbekistan (5.8%, a difference of 0.58%).
| Demographics | Rating | Rank | Unemployment |
| Cajuns | 0.8 /100 | #249 | Tragic 5.6% |
| Japanese | 0.8 /100 | #250 | Tragic 5.6% |
| Kiowa | 0.6 /100 | #251 | Tragic 5.7% |
| Hondurans | 0.3 /100 | #252 | Tragic 5.7% |
| Central Americans | 0.3 /100 | #253 | Tragic 5.7% |
| Immigrants | Honduras | 0.3 /100 | #254 | Tragic 5.7% |
| Immigrants | Portugal | 0.2 /100 | #255 | Tragic 5.7% |
| Guatemalans | 0.2 /100 | #256 | Tragic 5.8% |
| Yaqui | 0.2 /100 | #257 | Tragic 5.8% |
| Immigrants | Bahamas | 0.1 /100 | #258 | Tragic 5.8% |
| Sub-Saharan Africans | 0.1 /100 | #259 | Tragic 5.8% |
| Immigrants | Uzbekistan | 0.1 /100 | #260 | Tragic 5.8% |
| Immigrants | Guatemala | 0.1 /100 | #261 | Tragic 5.8% |
| Sierra Leoneans | 0.1 /100 | #262 | Tragic 5.8% |
| Salvadorans | 0.1 /100 | #263 | Tragic 5.8% |