Immigrants from Barbados vs Immigrants from Congo 1 or more Vehicles in Household
COMPARE
Immigrants from Barbados
Immigrants from Congo
1 or more Vehicles in Household
1 or more Vehicles in Household Comparison
Immigrants from Barbados
Immigrants from Congo
70.6%
1 OR MORE VEHICLES IN HOUSEHOLD
0.0/ 100
METRIC RATING
341st/ 347
METRIC RANK
90.0%
1 OR MORE VEHICLES IN HOUSEHOLD
71.2/ 100
METRIC RATING
157th/ 347
METRIC RANK
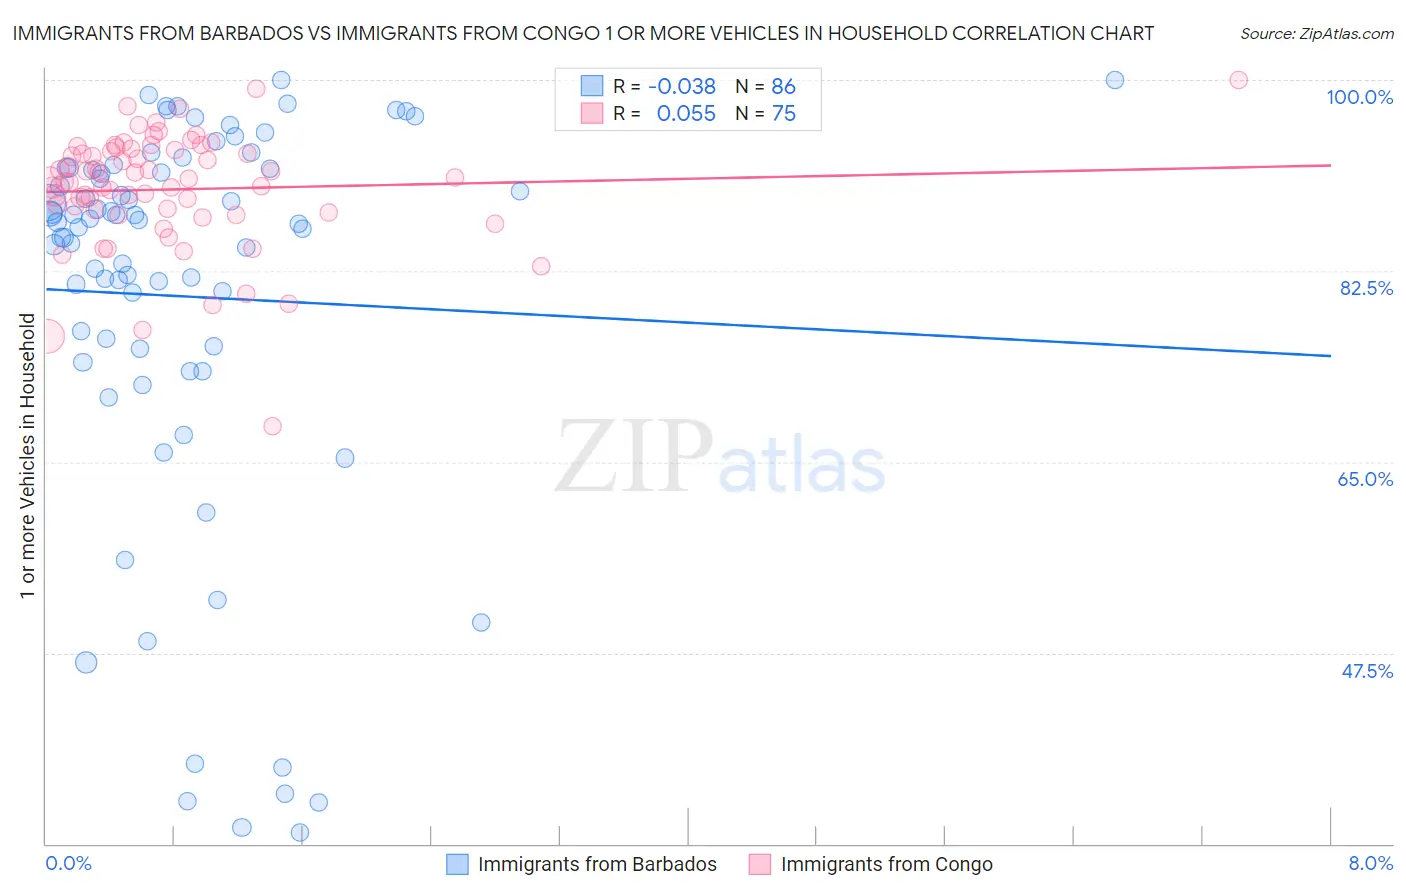
Immigrants from Barbados vs Immigrants from Congo 1 or more Vehicles in Household Correlation Chart
The statistical analysis conducted on geographies consisting of 112,776,758 people shows no correlation between the proportion of Immigrants from Barbados and percentage of households with 1 or more vehicles available in the United States with a correlation coefficient (R) of -0.038 and weighted average of 70.6%. Similarly, the statistical analysis conducted on geographies consisting of 92,096,115 people shows a slight positive correlation between the proportion of Immigrants from Congo and percentage of households with 1 or more vehicles available in the United States with a correlation coefficient (R) of 0.055 and weighted average of 90.0%, a difference of 27.5%.
1 or more Vehicles in Household Correlation Summary
| Measurement | Immigrants from Barbados | Immigrants from Congo |
| Minimum | 31.0% | 68.3% |
| Maximum | 100.0% | 100.0% |
| Range | 69.0% | 31.7% |
| Mean | 80.2% | 90.0% |
| Median | 86.9% | 90.9% |
| Interquartile 25% (IQ1) | 75.4% | 87.9% |
| Interquartile 75% (IQ3) | 91.9% | 93.6% |
| Interquartile Range (IQR) | 16.5% | 5.7% |
| Standard Deviation (Sample) | 18.1% | 5.4% |
| Standard Deviation (Population) | 18.0% | 5.3% |
Similar Demographics by 1 or more Vehicles in Household
Demographics Similar to Immigrants from Barbados by 1 or more Vehicles in Household
In terms of 1 or more vehicles in household, the demographic groups most similar to Immigrants from Barbados are Immigrants from Guyana (70.6%, a difference of 0.010%), Dominican (70.7%, a difference of 0.13%), Guyanese (70.8%, a difference of 0.32%), British West Indian (70.4%, a difference of 0.32%), and Inupiat (71.5%, a difference of 1.3%).
| Demographics | Rating | Rank | 1 or more Vehicles in Household |
| Immigrants | Ecuador | 0.0 /100 | #333 | Tragic 76.2% |
| Immigrants | Bangladesh | 0.0 /100 | #334 | Tragic 74.3% |
| Barbadians | 0.0 /100 | #335 | Tragic 74.0% |
| Vietnamese | 0.0 /100 | #336 | Tragic 73.8% |
| Immigrants | Uzbekistan | 0.0 /100 | #337 | Tragic 73.4% |
| Inupiat | 0.0 /100 | #338 | Tragic 71.5% |
| Guyanese | 0.0 /100 | #339 | Tragic 70.8% |
| Dominicans | 0.0 /100 | #340 | Tragic 70.7% |
| Immigrants | Barbados | 0.0 /100 | #341 | Tragic 70.6% |
| Immigrants | Guyana | 0.0 /100 | #342 | Tragic 70.6% |
| British West Indians | 0.0 /100 | #343 | Tragic 70.4% |
| Immigrants | Dominican Republic | 0.0 /100 | #344 | Tragic 68.6% |
| Immigrants | St. Vincent and the Grenadines | 0.0 /100 | #345 | Tragic 64.7% |
| Immigrants | Grenada | 0.0 /100 | #346 | Tragic 62.7% |
| Yup'ik | 0.0 /100 | #347 | Tragic 58.4% |
Demographics Similar to Immigrants from Congo by 1 or more Vehicles in Household
In terms of 1 or more vehicles in household, the demographic groups most similar to Immigrants from Congo are Brazilian (90.0%, a difference of 0.0%), Australian (90.0%, a difference of 0.020%), South African (90.0%, a difference of 0.030%), Immigrants from Indonesia (90.0%, a difference of 0.040%), and New Zealander (90.1%, a difference of 0.050%).
| Demographics | Rating | Rank | 1 or more Vehicles in Household |
| Immigrants | Micronesia | 75.9 /100 | #150 | Good 90.1% |
| Immigrants | Bosnia and Herzegovina | 75.4 /100 | #151 | Good 90.1% |
| Tlingit-Haida | 74.3 /100 | #152 | Good 90.1% |
| New Zealanders | 73.8 /100 | #153 | Good 90.1% |
| Immigrants | Uganda | 73.8 /100 | #154 | Good 90.1% |
| Immigrants | Immigrants | 73.6 /100 | #155 | Good 90.1% |
| Australians | 72.4 /100 | #156 | Good 90.0% |
| Immigrants | Congo | 71.2 /100 | #157 | Good 90.0% |
| Brazilians | 71.0 /100 | #158 | Good 90.0% |
| South Africans | 69.7 /100 | #159 | Good 90.0% |
| Immigrants | Indonesia | 68.8 /100 | #160 | Good 90.0% |
| Salvadorans | 68.7 /100 | #161 | Good 90.0% |
| Spanish American Indians | 67.0 /100 | #162 | Good 89.9% |
| Immigrants | Austria | 65.5 /100 | #163 | Good 89.9% |
| Comanche | 63.4 /100 | #164 | Good 89.9% |