Immigrants from Barbados vs Jamaican 1 or more Vehicles in Household
COMPARE
Immigrants from Barbados
Jamaican
1 or more Vehicles in Household
1 or more Vehicles in Household Comparison
Immigrants from Barbados
Jamaicans
70.6%
1 OR MORE VEHICLES IN HOUSEHOLD
0.0/ 100
METRIC RATING
341st/ 347
METRIC RANK
82.1%
1 OR MORE VEHICLES IN HOUSEHOLD
0.0/ 100
METRIC RATING
321st/ 347
METRIC RANK
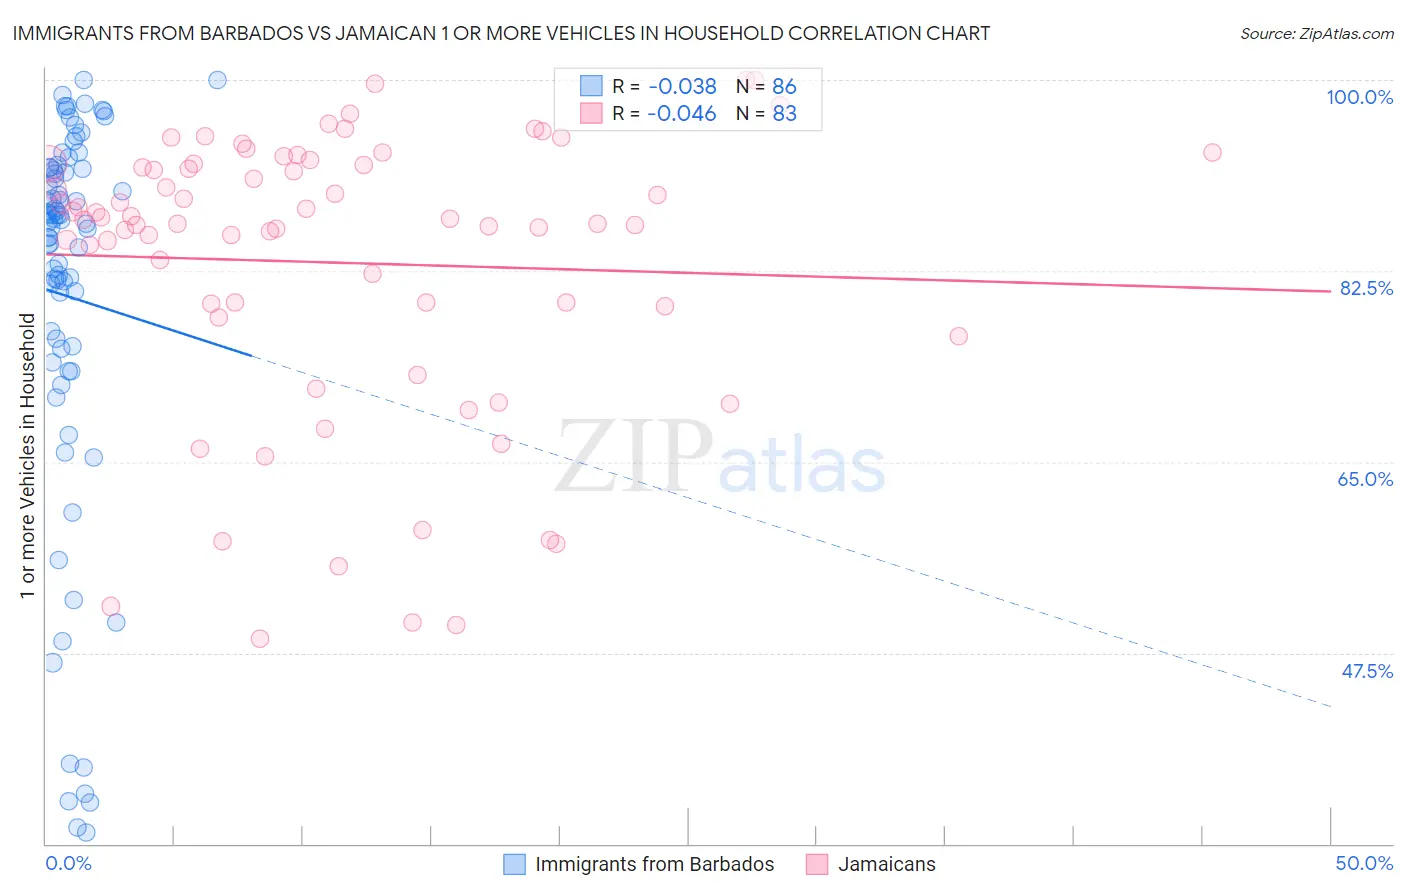
Immigrants from Barbados vs Jamaican 1 or more Vehicles in Household Correlation Chart
The statistical analysis conducted on geographies consisting of 112,776,758 people shows no correlation between the proportion of Immigrants from Barbados and percentage of households with 1 or more vehicles available in the United States with a correlation coefficient (R) of -0.038 and weighted average of 70.6%. Similarly, the statistical analysis conducted on geographies consisting of 367,719,271 people shows no correlation between the proportion of Jamaicans and percentage of households with 1 or more vehicles available in the United States with a correlation coefficient (R) of -0.046 and weighted average of 82.1%, a difference of 16.4%.
1 or more Vehicles in Household Correlation Summary
| Measurement | Immigrants from Barbados | Jamaican |
| Minimum | 31.0% | 48.7% |
| Maximum | 100.0% | 100.0% |
| Range | 69.0% | 51.3% |
| Mean | 80.2% | 83.3% |
| Median | 86.9% | 87.2% |
| Interquartile 25% (IQ1) | 75.4% | 79.3% |
| Interquartile 75% (IQ3) | 91.9% | 92.3% |
| Interquartile Range (IQR) | 16.5% | 13.0% |
| Standard Deviation (Sample) | 18.1% | 13.0% |
| Standard Deviation (Population) | 18.0% | 12.9% |
Demographics Similar to Immigrants from Barbados and Jamaicans by 1 or more Vehicles in Household
In terms of 1 or more vehicles in household, the demographic groups most similar to Immigrants from Barbados are Dominican (70.7%, a difference of 0.13%), Guyanese (70.8%, a difference of 0.32%), Inupiat (71.5%, a difference of 1.3%), Immigrants from Uzbekistan (73.4%, a difference of 4.0%), and Vietnamese (73.8%, a difference of 4.6%). Similarly, the demographic groups most similar to Jamaicans are Immigrants from Cabo Verde (81.6%, a difference of 0.67%), Immigrants from Yemen (80.5%, a difference of 2.0%), Immigrants from Caribbean (80.4%, a difference of 2.1%), Senegalese (80.4%, a difference of 2.2%), and Immigrants from West Indies (79.5%, a difference of 3.3%).
| Demographics | Rating | Rank | 1 or more Vehicles in Household |
| Jamaicans | 0.0 /100 | #321 | Tragic 82.1% |
| Immigrants | Cabo Verde | 0.0 /100 | #322 | Tragic 81.6% |
| Immigrants | Yemen | 0.0 /100 | #323 | Tragic 80.5% |
| Immigrants | Caribbean | 0.0 /100 | #324 | Tragic 80.4% |
| Senegalese | 0.0 /100 | #325 | Tragic 80.4% |
| Immigrants | West Indies | 0.0 /100 | #326 | Tragic 79.5% |
| Immigrants | Senegal | 0.0 /100 | #327 | Tragic 79.0% |
| Ecuadorians | 0.0 /100 | #328 | Tragic 77.9% |
| Immigrants | Dominica | 0.0 /100 | #329 | Tragic 77.8% |
| Immigrants | Trinidad and Tobago | 0.0 /100 | #330 | Tragic 76.8% |
| West Indians | 0.0 /100 | #331 | Tragic 76.4% |
| Trinidadians and Tobagonians | 0.0 /100 | #332 | Tragic 76.3% |
| Immigrants | Ecuador | 0.0 /100 | #333 | Tragic 76.2% |
| Immigrants | Bangladesh | 0.0 /100 | #334 | Tragic 74.3% |
| Barbadians | 0.0 /100 | #335 | Tragic 74.0% |
| Vietnamese | 0.0 /100 | #336 | Tragic 73.8% |
| Immigrants | Uzbekistan | 0.0 /100 | #337 | Tragic 73.4% |
| Inupiat | 0.0 /100 | #338 | Tragic 71.5% |
| Guyanese | 0.0 /100 | #339 | Tragic 70.8% |
| Dominicans | 0.0 /100 | #340 | Tragic 70.7% |
| Immigrants | Barbados | 0.0 /100 | #341 | Tragic 70.6% |