Immigrants from Pakistan vs Immigrants from Congo 1 or more Vehicles in Household
COMPARE
Immigrants from Pakistan
Immigrants from Congo
1 or more Vehicles in Household
1 or more Vehicles in Household Comparison
Immigrants from Pakistan
Immigrants from Congo
88.6%
1 OR MORE VEHICLES IN HOUSEHOLD
4.5/ 100
METRIC RATING
236th/ 347
METRIC RANK
90.0%
1 OR MORE VEHICLES IN HOUSEHOLD
71.2/ 100
METRIC RATING
157th/ 347
METRIC RANK
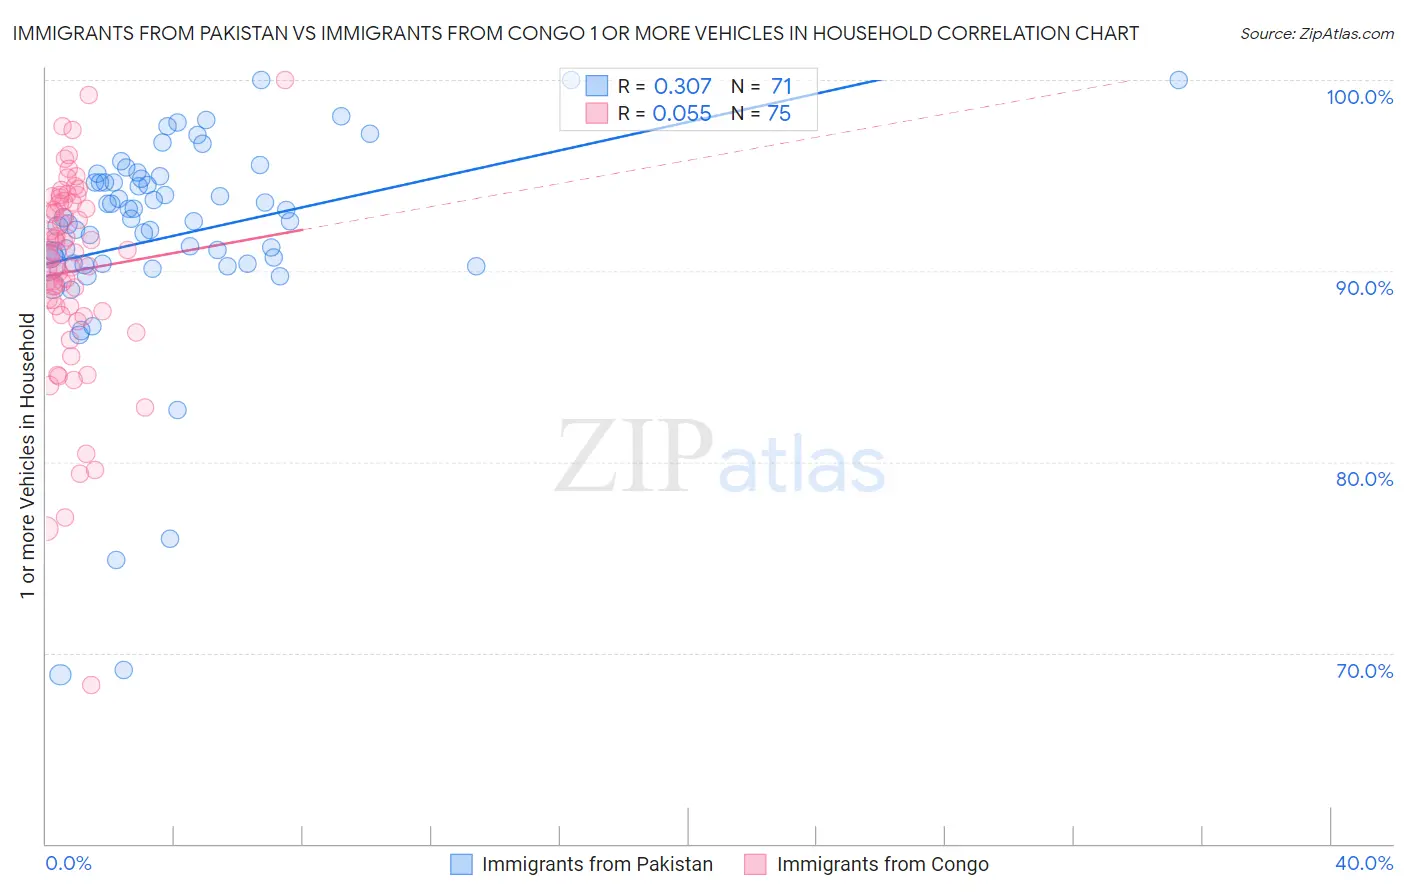
Immigrants from Pakistan vs Immigrants from Congo 1 or more Vehicles in Household Correlation Chart
The statistical analysis conducted on geographies consisting of 283,704,699 people shows a mild positive correlation between the proportion of Immigrants from Pakistan and percentage of households with 1 or more vehicles available in the United States with a correlation coefficient (R) of 0.307 and weighted average of 88.6%. Similarly, the statistical analysis conducted on geographies consisting of 92,096,115 people shows a slight positive correlation between the proportion of Immigrants from Congo and percentage of households with 1 or more vehicles available in the United States with a correlation coefficient (R) of 0.055 and weighted average of 90.0%, a difference of 1.6%.
1 or more Vehicles in Household Correlation Summary
| Measurement | Immigrants from Pakistan | Immigrants from Congo |
| Minimum | 68.8% | 68.3% |
| Maximum | 100.0% | 100.0% |
| Range | 31.2% | 31.7% |
| Mean | 91.9% | 90.0% |
| Median | 92.7% | 90.9% |
| Interquartile 25% (IQ1) | 90.4% | 87.9% |
| Interquartile 75% (IQ3) | 94.8% | 93.6% |
| Interquartile Range (IQR) | 4.4% | 5.7% |
| Standard Deviation (Sample) | 5.9% | 5.4% |
| Standard Deviation (Population) | 5.8% | 5.3% |
Similar Demographics by 1 or more Vehicles in Household
Demographics Similar to Immigrants from Pakistan by 1 or more Vehicles in Household
In terms of 1 or more vehicles in household, the demographic groups most similar to Immigrants from Pakistan are Paiute (88.6%, a difference of 0.010%), Immigrants from Turkey (88.6%, a difference of 0.010%), Immigrants from Peru (88.6%, a difference of 0.020%), Houma (88.6%, a difference of 0.030%), and Immigrants from Somalia (88.6%, a difference of 0.030%).
| Demographics | Rating | Rank | 1 or more Vehicles in Household |
| Immigrants | Romania | 5.4 /100 | #229 | Tragic 88.7% |
| Immigrants | Sierra Leone | 5.2 /100 | #230 | Tragic 88.7% |
| Russians | 5.0 /100 | #231 | Tragic 88.7% |
| Immigrants | Japan | 4.9 /100 | #232 | Tragic 88.7% |
| Houma | 4.8 /100 | #233 | Tragic 88.6% |
| Immigrants | Peru | 4.7 /100 | #234 | Tragic 88.6% |
| Paiute | 4.6 /100 | #235 | Tragic 88.6% |
| Immigrants | Pakistan | 4.5 /100 | #236 | Tragic 88.6% |
| Immigrants | Turkey | 4.4 /100 | #237 | Tragic 88.6% |
| Immigrants | Somalia | 4.2 /100 | #238 | Tragic 88.6% |
| Kiowa | 3.8 /100 | #239 | Tragic 88.6% |
| Eastern Europeans | 3.0 /100 | #240 | Tragic 88.5% |
| Taiwanese | 2.6 /100 | #241 | Tragic 88.4% |
| Turks | 2.5 /100 | #242 | Tragic 88.4% |
| Immigrants | Belgium | 2.1 /100 | #243 | Tragic 88.4% |
Demographics Similar to Immigrants from Congo by 1 or more Vehicles in Household
In terms of 1 or more vehicles in household, the demographic groups most similar to Immigrants from Congo are Brazilian (90.0%, a difference of 0.0%), Australian (90.0%, a difference of 0.020%), South African (90.0%, a difference of 0.030%), Immigrants from Indonesia (90.0%, a difference of 0.040%), and New Zealander (90.1%, a difference of 0.050%).
| Demographics | Rating | Rank | 1 or more Vehicles in Household |
| Immigrants | Micronesia | 75.9 /100 | #150 | Good 90.1% |
| Immigrants | Bosnia and Herzegovina | 75.4 /100 | #151 | Good 90.1% |
| Tlingit-Haida | 74.3 /100 | #152 | Good 90.1% |
| New Zealanders | 73.8 /100 | #153 | Good 90.1% |
| Immigrants | Uganda | 73.8 /100 | #154 | Good 90.1% |
| Immigrants | Immigrants | 73.6 /100 | #155 | Good 90.1% |
| Australians | 72.4 /100 | #156 | Good 90.0% |
| Immigrants | Congo | 71.2 /100 | #157 | Good 90.0% |
| Brazilians | 71.0 /100 | #158 | Good 90.0% |
| South Africans | 69.7 /100 | #159 | Good 90.0% |
| Immigrants | Indonesia | 68.8 /100 | #160 | Good 90.0% |
| Salvadorans | 68.7 /100 | #161 | Good 90.0% |
| Spanish American Indians | 67.0 /100 | #162 | Good 89.9% |
| Immigrants | Austria | 65.5 /100 | #163 | Good 89.9% |
| Comanche | 63.4 /100 | #164 | Good 89.9% |