Immigrants from Barbados vs Turkish 1 or more Vehicles in Household
COMPARE
Immigrants from Barbados
Turkish
1 or more Vehicles in Household
1 or more Vehicles in Household Comparison
Immigrants from Barbados
Turks
70.6%
1 OR MORE VEHICLES IN HOUSEHOLD
0.0/ 100
METRIC RATING
341st/ 347
METRIC RANK
88.4%
1 OR MORE VEHICLES IN HOUSEHOLD
2.5/ 100
METRIC RATING
242nd/ 347
METRIC RANK
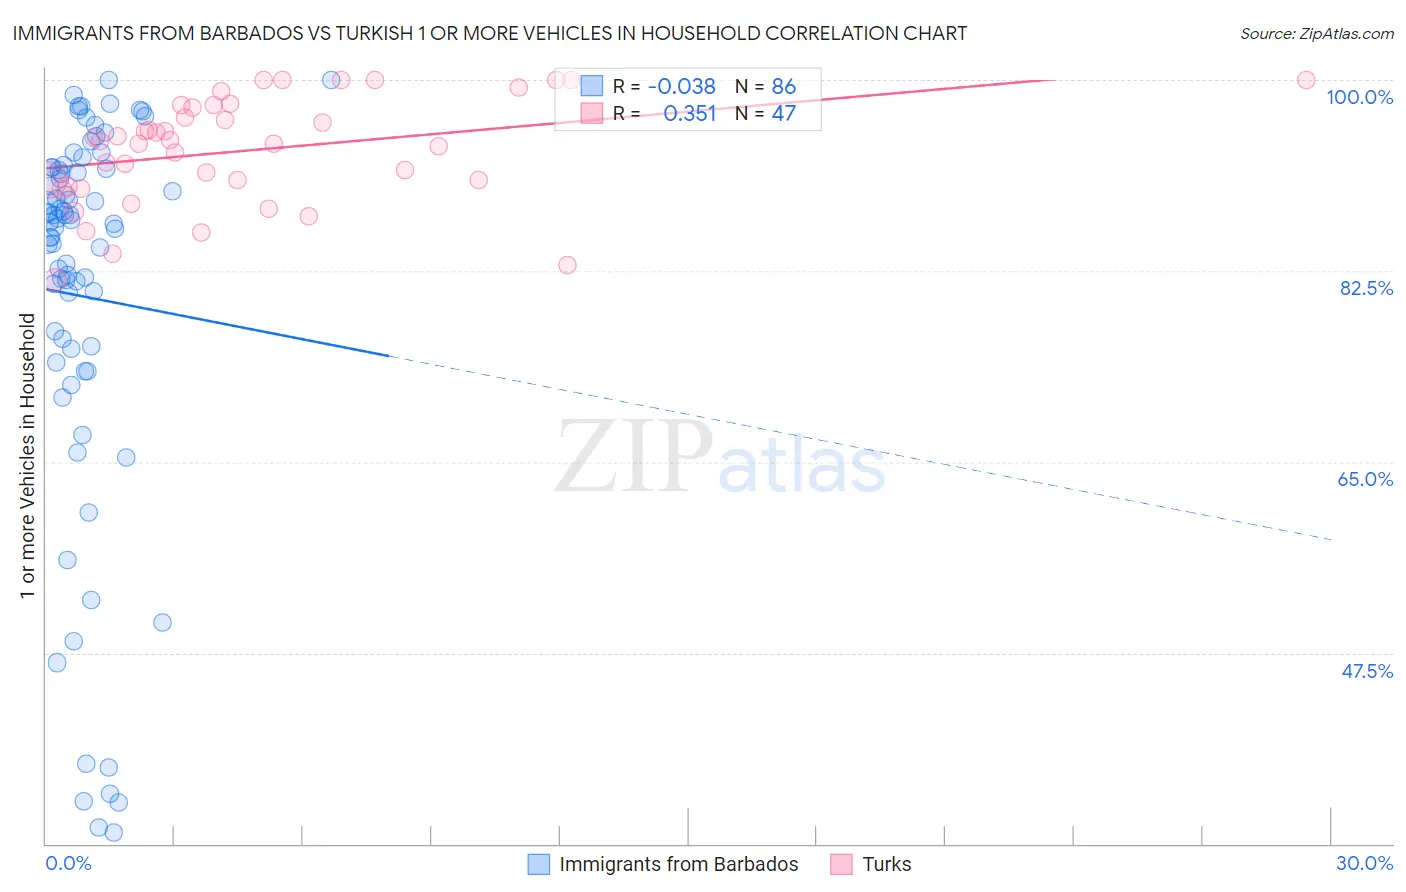
Immigrants from Barbados vs Turkish 1 or more Vehicles in Household Correlation Chart
The statistical analysis conducted on geographies consisting of 112,776,758 people shows no correlation between the proportion of Immigrants from Barbados and percentage of households with 1 or more vehicles available in the United States with a correlation coefficient (R) of -0.038 and weighted average of 70.6%. Similarly, the statistical analysis conducted on geographies consisting of 271,719,396 people shows a mild positive correlation between the proportion of Turks and percentage of households with 1 or more vehicles available in the United States with a correlation coefficient (R) of 0.351 and weighted average of 88.4%, a difference of 25.3%.
1 or more Vehicles in Household Correlation Summary
| Measurement | Immigrants from Barbados | Turkish |
| Minimum | 31.0% | 81.7% |
| Maximum | 100.0% | 100.0% |
| Range | 69.0% | 18.3% |
| Mean | 80.2% | 93.6% |
| Median | 86.9% | 94.4% |
| Interquartile 25% (IQ1) | 75.4% | 90.3% |
| Interquartile 75% (IQ3) | 91.9% | 97.7% |
| Interquartile Range (IQR) | 16.5% | 7.4% |
| Standard Deviation (Sample) | 18.1% | 4.9% |
| Standard Deviation (Population) | 18.0% | 4.9% |
Similar Demographics by 1 or more Vehicles in Household
Demographics Similar to Immigrants from Barbados by 1 or more Vehicles in Household
In terms of 1 or more vehicles in household, the demographic groups most similar to Immigrants from Barbados are Immigrants from Guyana (70.6%, a difference of 0.010%), Dominican (70.7%, a difference of 0.13%), Guyanese (70.8%, a difference of 0.32%), British West Indian (70.4%, a difference of 0.32%), and Inupiat (71.5%, a difference of 1.3%).
| Demographics | Rating | Rank | 1 or more Vehicles in Household |
| Immigrants | Ecuador | 0.0 /100 | #333 | Tragic 76.2% |
| Immigrants | Bangladesh | 0.0 /100 | #334 | Tragic 74.3% |
| Barbadians | 0.0 /100 | #335 | Tragic 74.0% |
| Vietnamese | 0.0 /100 | #336 | Tragic 73.8% |
| Immigrants | Uzbekistan | 0.0 /100 | #337 | Tragic 73.4% |
| Inupiat | 0.0 /100 | #338 | Tragic 71.5% |
| Guyanese | 0.0 /100 | #339 | Tragic 70.8% |
| Dominicans | 0.0 /100 | #340 | Tragic 70.7% |
| Immigrants | Barbados | 0.0 /100 | #341 | Tragic 70.6% |
| Immigrants | Guyana | 0.0 /100 | #342 | Tragic 70.6% |
| British West Indians | 0.0 /100 | #343 | Tragic 70.4% |
| Immigrants | Dominican Republic | 0.0 /100 | #344 | Tragic 68.6% |
| Immigrants | St. Vincent and the Grenadines | 0.0 /100 | #345 | Tragic 64.7% |
| Immigrants | Grenada | 0.0 /100 | #346 | Tragic 62.7% |
| Yup'ik | 0.0 /100 | #347 | Tragic 58.4% |
Demographics Similar to Turks by 1 or more Vehicles in Household
In terms of 1 or more vehicles in household, the demographic groups most similar to Turks are Taiwanese (88.4%, a difference of 0.020%), Immigrants from Belgium (88.4%, a difference of 0.060%), Eastern European (88.5%, a difference of 0.070%), Immigrants from Portugal (88.3%, a difference of 0.080%), and Immigrants from Czechoslovakia (88.3%, a difference of 0.10%).
| Demographics | Rating | Rank | 1 or more Vehicles in Household |
| Paiute | 4.6 /100 | #235 | Tragic 88.6% |
| Immigrants | Pakistan | 4.5 /100 | #236 | Tragic 88.6% |
| Immigrants | Turkey | 4.4 /100 | #237 | Tragic 88.6% |
| Immigrants | Somalia | 4.2 /100 | #238 | Tragic 88.6% |
| Kiowa | 3.8 /100 | #239 | Tragic 88.6% |
| Eastern Europeans | 3.0 /100 | #240 | Tragic 88.5% |
| Taiwanese | 2.6 /100 | #241 | Tragic 88.4% |
| Turks | 2.5 /100 | #242 | Tragic 88.4% |
| Immigrants | Belgium | 2.1 /100 | #243 | Tragic 88.4% |
| Immigrants | Portugal | 2.0 /100 | #244 | Tragic 88.3% |
| Immigrants | Czechoslovakia | 1.9 /100 | #245 | Tragic 88.3% |
| Menominee | 1.9 /100 | #246 | Tragic 88.3% |
| Immigrants | Honduras | 1.7 /100 | #247 | Tragic 88.3% |
| Immigrants | Nigeria | 1.5 /100 | #248 | Tragic 88.2% |
| Blacks/African Americans | 1.4 /100 | #249 | Tragic 88.2% |