Immigrants from Barbados vs Immigrants from Italy 1 or more Vehicles in Household
COMPARE
Immigrants from Barbados
Immigrants from Italy
1 or more Vehicles in Household
1 or more Vehicles in Household Comparison
Immigrants from Barbados
Immigrants from Italy
70.6%
1 OR MORE VEHICLES IN HOUSEHOLD
0.0/ 100
METRIC RATING
341st/ 347
METRIC RANK
89.1%
1 OR MORE VEHICLES IN HOUSEHOLD
14.0/ 100
METRIC RATING
209th/ 347
METRIC RANK
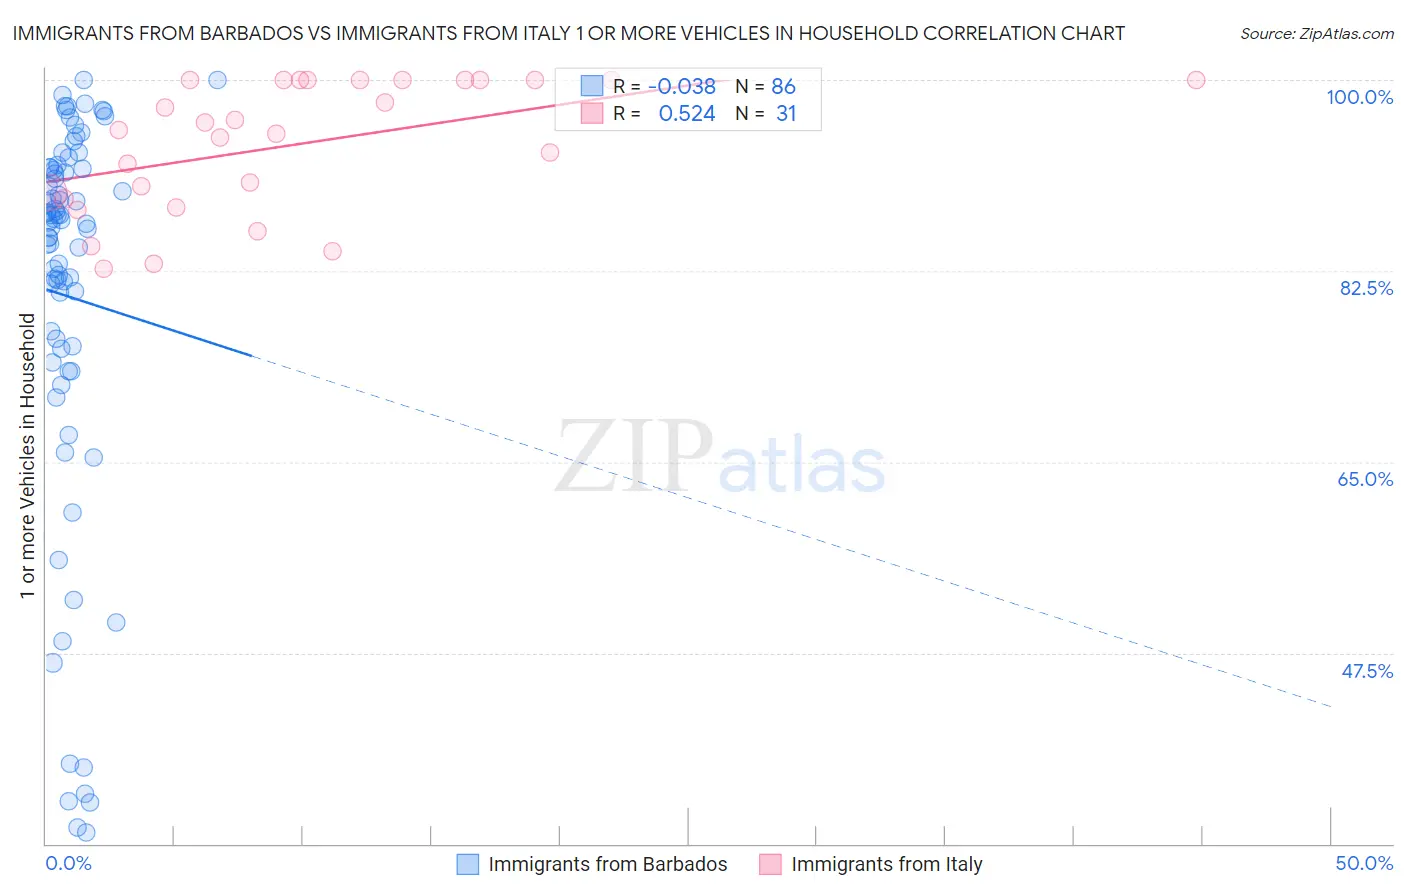
Immigrants from Barbados vs Immigrants from Italy 1 or more Vehicles in Household Correlation Chart
The statistical analysis conducted on geographies consisting of 112,776,758 people shows no correlation between the proportion of Immigrants from Barbados and percentage of households with 1 or more vehicles available in the United States with a correlation coefficient (R) of -0.038 and weighted average of 70.6%. Similarly, the statistical analysis conducted on geographies consisting of 324,164,676 people shows a substantial positive correlation between the proportion of Immigrants from Italy and percentage of households with 1 or more vehicles available in the United States with a correlation coefficient (R) of 0.524 and weighted average of 89.1%, a difference of 26.2%.
1 or more Vehicles in Household Correlation Summary
| Measurement | Immigrants from Barbados | Immigrants from Italy |
| Minimum | 31.0% | 82.7% |
| Maximum | 100.0% | 100.0% |
| Range | 69.0% | 17.3% |
| Mean | 80.2% | 94.1% |
| Median | 86.9% | 95.4% |
| Interquartile 25% (IQ1) | 75.4% | 89.1% |
| Interquartile 75% (IQ3) | 91.9% | 100.0% |
| Interquartile Range (IQR) | 16.5% | 10.9% |
| Standard Deviation (Sample) | 18.1% | 5.9% |
| Standard Deviation (Population) | 18.0% | 5.8% |
Similar Demographics by 1 or more Vehicles in Household
Demographics Similar to Immigrants from Barbados by 1 or more Vehicles in Household
In terms of 1 or more vehicles in household, the demographic groups most similar to Immigrants from Barbados are Immigrants from Guyana (70.6%, a difference of 0.010%), Dominican (70.7%, a difference of 0.13%), Guyanese (70.8%, a difference of 0.32%), British West Indian (70.4%, a difference of 0.32%), and Inupiat (71.5%, a difference of 1.3%).
| Demographics | Rating | Rank | 1 or more Vehicles in Household |
| Immigrants | Ecuador | 0.0 /100 | #333 | Tragic 76.2% |
| Immigrants | Bangladesh | 0.0 /100 | #334 | Tragic 74.3% |
| Barbadians | 0.0 /100 | #335 | Tragic 74.0% |
| Vietnamese | 0.0 /100 | #336 | Tragic 73.8% |
| Immigrants | Uzbekistan | 0.0 /100 | #337 | Tragic 73.4% |
| Inupiat | 0.0 /100 | #338 | Tragic 71.5% |
| Guyanese | 0.0 /100 | #339 | Tragic 70.8% |
| Dominicans | 0.0 /100 | #340 | Tragic 70.7% |
| Immigrants | Barbados | 0.0 /100 | #341 | Tragic 70.6% |
| Immigrants | Guyana | 0.0 /100 | #342 | Tragic 70.6% |
| British West Indians | 0.0 /100 | #343 | Tragic 70.4% |
| Immigrants | Dominican Republic | 0.0 /100 | #344 | Tragic 68.6% |
| Immigrants | St. Vincent and the Grenadines | 0.0 /100 | #345 | Tragic 64.7% |
| Immigrants | Grenada | 0.0 /100 | #346 | Tragic 62.7% |
| Yup'ik | 0.0 /100 | #347 | Tragic 58.4% |
Demographics Similar to Immigrants from Italy by 1 or more Vehicles in Household
In terms of 1 or more vehicles in household, the demographic groups most similar to Immigrants from Italy are Immigrants from Chile (89.1%, a difference of 0.010%), Dutch West Indian (89.0%, a difference of 0.020%), Immigrants from Denmark (89.1%, a difference of 0.030%), Sierra Leonean (89.0%, a difference of 0.030%), and Somali (89.0%, a difference of 0.040%).
| Demographics | Rating | Rank | 1 or more Vehicles in Household |
| Iroquois | 19.8 /100 | #202 | Poor 89.2% |
| Cambodians | 18.9 /100 | #203 | Poor 89.2% |
| Romanians | 18.2 /100 | #204 | Poor 89.2% |
| Guatemalans | 17.8 /100 | #205 | Poor 89.2% |
| Apache | 16.2 /100 | #206 | Poor 89.1% |
| Immigrants | Denmark | 14.8 /100 | #207 | Poor 89.1% |
| Immigrants | Chile | 14.4 /100 | #208 | Poor 89.1% |
| Immigrants | Italy | 14.0 /100 | #209 | Poor 89.1% |
| Dutch West Indians | 13.5 /100 | #210 | Poor 89.0% |
| Sierra Leoneans | 13.0 /100 | #211 | Poor 89.0% |
| Somalis | 12.8 /100 | #212 | Poor 89.0% |
| Immigrants | Western Asia | 12.3 /100 | #213 | Poor 89.0% |
| Immigrants | Hungary | 11.9 /100 | #214 | Poor 89.0% |
| Immigrants | Sri Lanka | 10.2 /100 | #215 | Poor 88.9% |
| Immigrants | Argentina | 9.4 /100 | #216 | Tragic 88.9% |