Immigrants from Barbados vs British West Indian 1 or more Vehicles in Household
COMPARE
Immigrants from Barbados
British West Indian
1 or more Vehicles in Household
1 or more Vehicles in Household Comparison
Immigrants from Barbados
British West Indians
70.6%
1 OR MORE VEHICLES IN HOUSEHOLD
0.0/ 100
METRIC RATING
341st/ 347
METRIC RANK
70.4%
1 OR MORE VEHICLES IN HOUSEHOLD
0.0/ 100
METRIC RATING
343rd/ 347
METRIC RANK
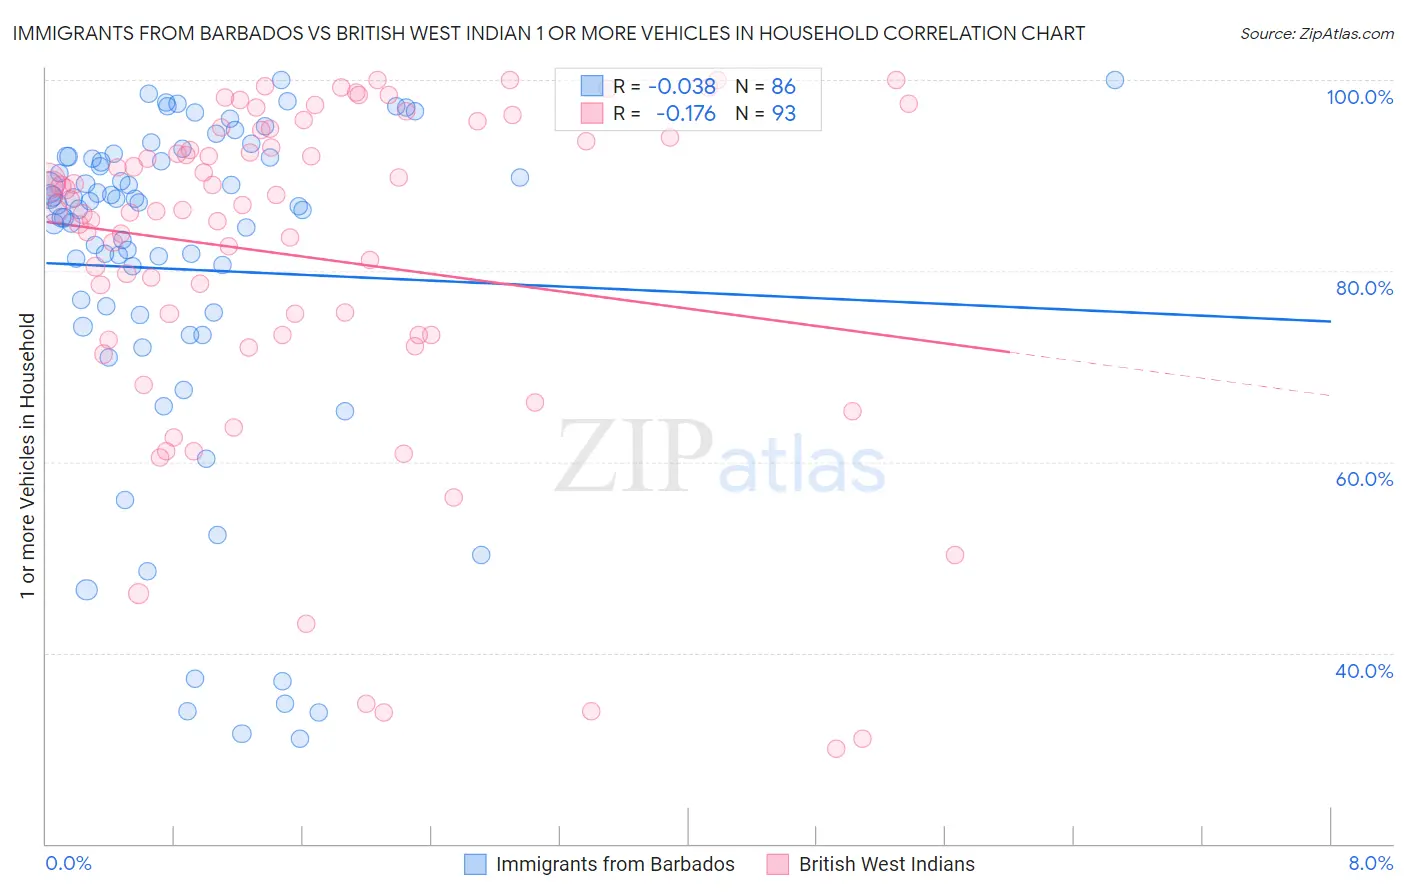
Immigrants from Barbados vs British West Indian 1 or more Vehicles in Household Correlation Chart
The statistical analysis conducted on geographies consisting of 112,776,758 people shows no correlation between the proportion of Immigrants from Barbados and percentage of households with 1 or more vehicles available in the United States with a correlation coefficient (R) of -0.038 and weighted average of 70.6%. Similarly, the statistical analysis conducted on geographies consisting of 152,639,821 people shows a poor negative correlation between the proportion of British West Indians and percentage of households with 1 or more vehicles available in the United States with a correlation coefficient (R) of -0.176 and weighted average of 70.4%, a difference of 0.32%.
1 or more Vehicles in Household Correlation Summary
| Measurement | Immigrants from Barbados | British West Indian |
| Minimum | 31.0% | 30.0% |
| Maximum | 100.0% | 100.0% |
| Range | 69.0% | 70.0% |
| Mean | 80.2% | 81.5% |
| Median | 86.9% | 86.4% |
| Interquartile 25% (IQ1) | 75.4% | 73.2% |
| Interquartile 75% (IQ3) | 91.9% | 94.3% |
| Interquartile Range (IQR) | 16.5% | 21.1% |
| Standard Deviation (Sample) | 18.1% | 17.6% |
| Standard Deviation (Population) | 18.0% | 17.5% |
Demographics Similar to Immigrants from Barbados and British West Indians by 1 or more Vehicles in Household
In terms of 1 or more vehicles in household, the demographic groups most similar to Immigrants from Barbados are Immigrants from Guyana (70.6%, a difference of 0.010%), Dominican (70.7%, a difference of 0.13%), Guyanese (70.8%, a difference of 0.32%), Inupiat (71.5%, a difference of 1.3%), and Immigrants from Dominican Republic (68.6%, a difference of 2.8%). Similarly, the demographic groups most similar to British West Indians are Immigrants from Guyana (70.6%, a difference of 0.31%), Dominican (70.7%, a difference of 0.46%), Guyanese (70.8%, a difference of 0.64%), Inupiat (71.5%, a difference of 1.7%), and Immigrants from Dominican Republic (68.6%, a difference of 2.5%).
| Demographics | Rating | Rank | 1 or more Vehicles in Household |
| Ecuadorians | 0.0 /100 | #328 | Tragic 77.9% |
| Immigrants | Dominica | 0.0 /100 | #329 | Tragic 77.8% |
| Immigrants | Trinidad and Tobago | 0.0 /100 | #330 | Tragic 76.8% |
| West Indians | 0.0 /100 | #331 | Tragic 76.4% |
| Trinidadians and Tobagonians | 0.0 /100 | #332 | Tragic 76.3% |
| Immigrants | Ecuador | 0.0 /100 | #333 | Tragic 76.2% |
| Immigrants | Bangladesh | 0.0 /100 | #334 | Tragic 74.3% |
| Barbadians | 0.0 /100 | #335 | Tragic 74.0% |
| Vietnamese | 0.0 /100 | #336 | Tragic 73.8% |
| Immigrants | Uzbekistan | 0.0 /100 | #337 | Tragic 73.4% |
| Inupiat | 0.0 /100 | #338 | Tragic 71.5% |
| Guyanese | 0.0 /100 | #339 | Tragic 70.8% |
| Dominicans | 0.0 /100 | #340 | Tragic 70.7% |
| Immigrants | Barbados | 0.0 /100 | #341 | Tragic 70.6% |
| Immigrants | Guyana | 0.0 /100 | #342 | Tragic 70.6% |
| British West Indians | 0.0 /100 | #343 | Tragic 70.4% |
| Immigrants | Dominican Republic | 0.0 /100 | #344 | Tragic 68.6% |
| Immigrants | St. Vincent and the Grenadines | 0.0 /100 | #345 | Tragic 64.7% |
| Immigrants | Grenada | 0.0 /100 | #346 | Tragic 62.7% |
| Yup'ik | 0.0 /100 | #347 | Tragic 58.4% |