Immigrants from Barbados vs Immigrants from Asia 1 or more Vehicles in Household
COMPARE
Immigrants from Barbados
Immigrants from Asia
1 or more Vehicles in Household
1 or more Vehicles in Household Comparison
Immigrants from Barbados
Immigrants from Asia
70.6%
1 OR MORE VEHICLES IN HOUSEHOLD
0.0/ 100
METRIC RATING
341st/ 347
METRIC RANK
89.3%
1 OR MORE VEHICLES IN HOUSEHOLD
22.8/ 100
METRIC RATING
199th/ 347
METRIC RANK
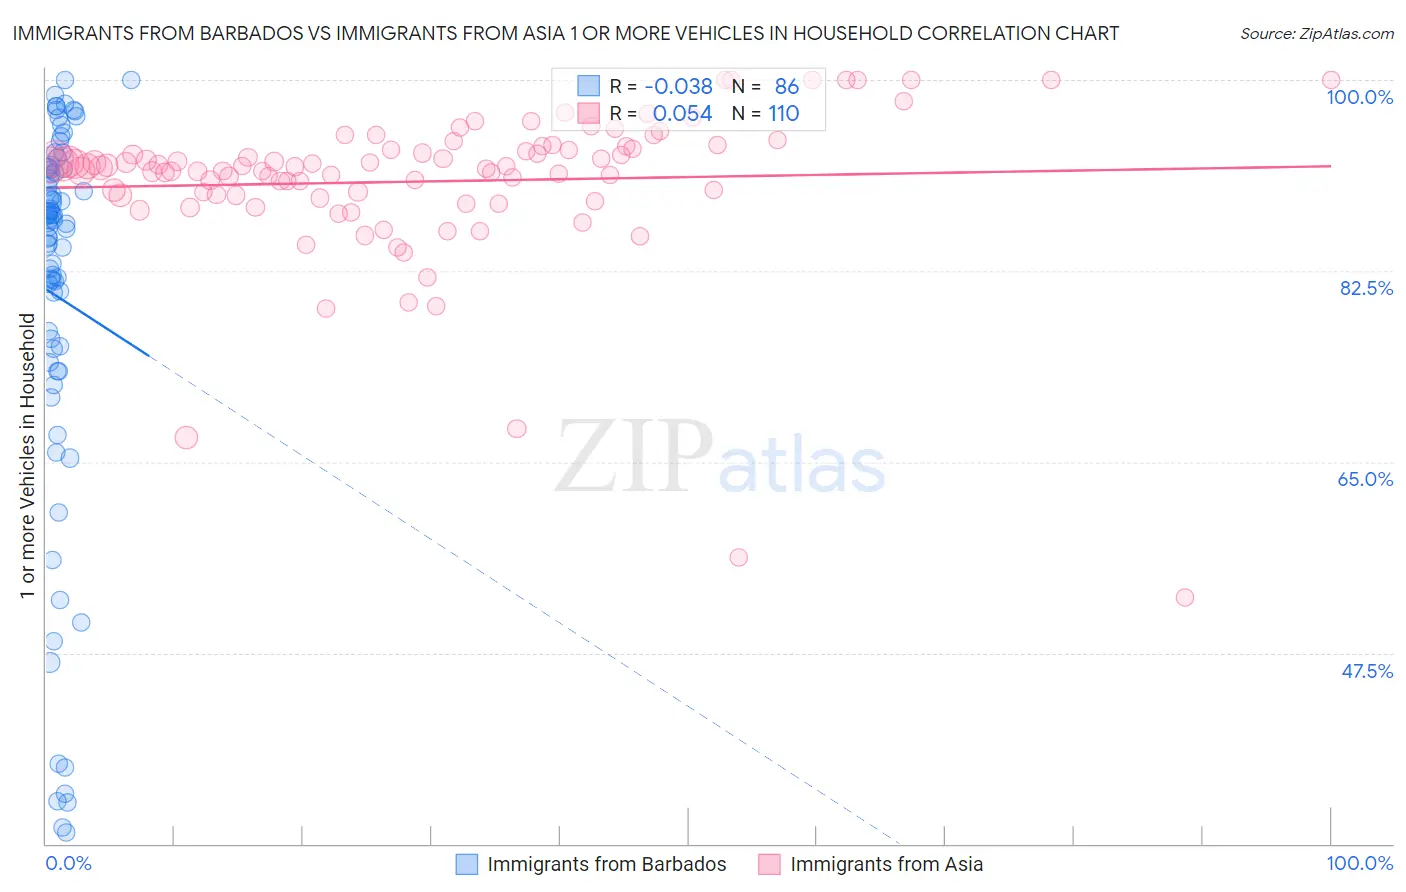
Immigrants from Barbados vs Immigrants from Asia 1 or more Vehicles in Household Correlation Chart
The statistical analysis conducted on geographies consisting of 112,776,758 people shows no correlation between the proportion of Immigrants from Barbados and percentage of households with 1 or more vehicles available in the United States with a correlation coefficient (R) of -0.038 and weighted average of 70.6%. Similarly, the statistical analysis conducted on geographies consisting of 548,543,467 people shows a slight positive correlation between the proportion of Immigrants from Asia and percentage of households with 1 or more vehicles available in the United States with a correlation coefficient (R) of 0.054 and weighted average of 89.3%, a difference of 26.5%.
1 or more Vehicles in Household Correlation Summary
| Measurement | Immigrants from Barbados | Immigrants from Asia |
| Minimum | 31.0% | 52.6% |
| Maximum | 100.0% | 100.0% |
| Range | 69.0% | 47.4% |
| Mean | 80.2% | 90.7% |
| Median | 86.9% | 92.1% |
| Interquartile 25% (IQ1) | 75.4% | 89.4% |
| Interquartile 75% (IQ3) | 91.9% | 93.7% |
| Interquartile Range (IQR) | 16.5% | 4.3% |
| Standard Deviation (Sample) | 18.1% | 7.3% |
| Standard Deviation (Population) | 18.0% | 7.2% |
Similar Demographics by 1 or more Vehicles in Household
Demographics Similar to Immigrants from Barbados by 1 or more Vehicles in Household
In terms of 1 or more vehicles in household, the demographic groups most similar to Immigrants from Barbados are Immigrants from Guyana (70.6%, a difference of 0.010%), Dominican (70.7%, a difference of 0.13%), Guyanese (70.8%, a difference of 0.32%), British West Indian (70.4%, a difference of 0.32%), and Inupiat (71.5%, a difference of 1.3%).
| Demographics | Rating | Rank | 1 or more Vehicles in Household |
| Immigrants | Ecuador | 0.0 /100 | #333 | Tragic 76.2% |
| Immigrants | Bangladesh | 0.0 /100 | #334 | Tragic 74.3% |
| Barbadians | 0.0 /100 | #335 | Tragic 74.0% |
| Vietnamese | 0.0 /100 | #336 | Tragic 73.8% |
| Immigrants | Uzbekistan | 0.0 /100 | #337 | Tragic 73.4% |
| Inupiat | 0.0 /100 | #338 | Tragic 71.5% |
| Guyanese | 0.0 /100 | #339 | Tragic 70.8% |
| Dominicans | 0.0 /100 | #340 | Tragic 70.7% |
| Immigrants | Barbados | 0.0 /100 | #341 | Tragic 70.6% |
| Immigrants | Guyana | 0.0 /100 | #342 | Tragic 70.6% |
| British West Indians | 0.0 /100 | #343 | Tragic 70.4% |
| Immigrants | Dominican Republic | 0.0 /100 | #344 | Tragic 68.6% |
| Immigrants | St. Vincent and the Grenadines | 0.0 /100 | #345 | Tragic 64.7% |
| Immigrants | Grenada | 0.0 /100 | #346 | Tragic 62.7% |
| Yup'ik | 0.0 /100 | #347 | Tragic 58.4% |
Demographics Similar to Immigrants from Asia by 1 or more Vehicles in Household
In terms of 1 or more vehicles in household, the demographic groups most similar to Immigrants from Asia are Pennsylvania German (89.3%, a difference of 0.0%), Immigrants from Sweden (89.3%, a difference of 0.020%), Crow (89.3%, a difference of 0.030%), Central American (89.2%, a difference of 0.030%), and Immigrants from Western Europe (89.2%, a difference of 0.050%).
| Demographics | Rating | Rank | 1 or more Vehicles in Household |
| Immigrants | North Macedonia | 36.5 /100 | #192 | Fair 89.5% |
| Immigrants | Northern Europe | 35.5 /100 | #193 | Fair 89.5% |
| Immigrants | Eritrea | 33.2 /100 | #194 | Fair 89.4% |
| Immigrants | Armenia | 31.8 /100 | #195 | Fair 89.4% |
| Crow | 24.3 /100 | #196 | Fair 89.3% |
| Immigrants | Sweden | 23.6 /100 | #197 | Fair 89.3% |
| Pennsylvania Germans | 22.9 /100 | #198 | Fair 89.3% |
| Immigrants | Asia | 22.8 /100 | #199 | Fair 89.3% |
| Central Americans | 21.4 /100 | #200 | Fair 89.2% |
| Immigrants | Western Europe | 20.5 /100 | #201 | Fair 89.2% |
| Iroquois | 19.8 /100 | #202 | Poor 89.2% |
| Cambodians | 18.9 /100 | #203 | Poor 89.2% |
| Romanians | 18.2 /100 | #204 | Poor 89.2% |
| Guatemalans | 17.8 /100 | #205 | Poor 89.2% |
| Apache | 16.2 /100 | #206 | Poor 89.1% |